


CEO.CA Weekly Wrap
A look at some of the week’s best chats and charts on CEO.CA, a community and platform for Canada’s venture stock markets.
Brought to you by CEO.CA Pro. Better mobile stock market data from $50/month.
Before I delve into some of the more interesting stories of the week I want to take a step back and speak into what the point of all this is. Why should anyone invest in the stock market? Why should anyone buy shares in a junior mining company OR any other company for that matter? Why post chat comments on CEO.ca or any other internet investment forum?
Why are you reading this blog post? What’s the point of it all?
The obvious answer is “to make money”. True, the purpose of investing is to grow ones wealth over time. But why not buy the S&P 500 exchange traded fund SPY and walk away? How can anyone believe they can actually pick individual stocks? In particular, junior mining stocks are notoriously treacherous and extremely volatile with many stocks losing 90%+ of their value over time. However, it is the allure of enormous percentage gains, the “10-baggers” (900% gains), that has investors continue to speculate in the junior mining sector. The thrill of riding a micro-cap stock to a multi-hundred percent or thousand percent gain is like few others. It is this upside potential that has many of us sifting through hundreds of mostly garbage companies that will never develop a mineable resource.
I think if I polled ten different CEO.ca users I might get ten different answers as to why they trade, invest, and choose to read and post content on a social investment forum. I can only speak for myself. Markets are a passion of mine, and CEO.ca is an indispensable tool for getting news in real time, getting real time quotes and level 2 market depth on TSX/TSX-V listed stocks, obtaining insights from other knowledgeable users, and for measuring market sentiment in real time.
Sharing my passion with others is obviously one of the major benefits of CEO.ca or any other social media tool, and I relish some of the feedback and comments that I receive from blog posts and/or chat comments. I truly believe we can all benefit from sharing information and ideas with one another in a healthy and constructive dialogue.
While many may think of markets as a zero sum game, I don't see it that way. Financial markets help create wealth, not only for company founders and employees, but also for the investors in those companies. Bull markets create tremendous wealth as the economy expands and profits grow. Many people (including the proverbial herd) can benefit from a rising tide as it lifts all boats (or almost all boats…).
As I began to point out in last week’s Weekly Wrap, I think we could very well be on the verge of a notable bull run in the precious metals and junior mining sectors. While there will be short term gyrations and down days/weeks along the way, I think we will continue to see higher highs and higher lows in gold and across precious metals mining shares. Now let’s delve into some of what happened last week in the junior mining sector.
For the past year or so I have been casually following a company called Minera Alamos (TSX-V:MAI) but for whatever reason it never felt like there was an urgency to buy the stock. This was primarily due to the high share count and the number of outstanding warrants that were hanging over the stock. My opinion changed last Monday as the gold rally got into full swing and I was looking for gold developers that could deliver operating leverage to a rising gold price. Minera Alamos caught my attention ‘again’ two weeks ago after @CautiousNow reported on his observations from the May Metals Investor Forum (MIF):

It’s interesting because @CautiousNow cited the exact same reasons why I had held off on buying the stock (large share count, warrant overhang) for so long. With the warrant overhang rapidly coming to an end, and the timeline to production at MAI’s flagship Santana Project now less than a year, suddenly there was an urgency to pick up MAI shares while they were still “cheap”.
CEO.ca user @TheGalvanizer is MAI's President Doug Ramshaw. Doug is not only a large MAI shareholder (nearly 4,000,000 shares at last check) but he is also a regular participant on the MAI channel, often offering timely insights and up-to-date information:

At C$.12 per share with ~350 million shares outstanding MAI has a C$42 million market cap (US$31.6 million). This is far from a hefty valuation for a company that has C$5 million in cash, two projects (Santana in the Sonora State of Mexico and La Fortuna in Durango State) with fast paths to production, and a strategic partnership with Osisko Gold Royalties which will likely enable Minera Alamos to finance project construction at Santana and La Fortuna with minimal shareholder dilution.
MAI’s goal is to achieve 100,000 ounces of gold production per year within a few years once production at Santana and La Fortuna have been fully ramped up. If all goes well it’s possible that MAI could reach the 100,000 ounce production mark as soon as 2022, and the first gold pour at Santana could occur as early as the 1st half of 2020.
The key catalysts for MAI over the next year are pretty clear and straightforward:
- Approval of Santana mining permit (imminent)
- Approval of La Fortuna mining permit (imminent)
- Beginning of construction at Santana (Q3/Q4 2019)
- La Fortuna construction decision (Q3 2019)
- First gold pour at Santana (1st half of 2020)
I believe the receipt of mining permits for both Santana and La Fortuna are significant catalysts which could result in a substantial increase in the MAI share price in the next couple of months. In a report dated April 30th Haywood Securities research offered a bullish outlook for MAI shares citing a downside scenario target price of C$.10 and an upside price target of C$.40. Haywood also pointed out that Minera Alamos is trading at a US$27 enterprise value per ounce of gold in the ground compared to a US$45 average for its peer group. It’s clear to me that MAI is undervalued at current levels and the receipt of mining permits for Santana and La Fortuna will go a long way towards de-risking these projects and lifting MAI’s valuation closer to its peer group.
In my estimation this is an attractive spot to be getting into MAI shares (I bought MAI shares last week), and an already attractive situation could be made even sweeter with a rising gold price and/or exploration success at La Fortuna or Santana which could end up making Haywood’s C$.40 price target look conservative.
CEO.ca Level 2 Market Depth helped to visualize the bid strength at C$.105 and C$.11 which persisted throughout the week before MAI closed at C$.12 on Friday:
From a technical chart standpoint, above C$.13 the next levels of resistance are C$.17/$.18 and then C$.22/$.23. The C$.10 level is now a major downside support level.
MAI.V (Daily - Two Year)

MAI has formed a broad based bottom over the last year and a weekly close above C$.13 would help to confirm that the tide has turned and a new uptrend is underway.
Turning to some of the other major stories of the week Royal Nickel delivered some much awaited good news for shareholders with the announcement of the discovery of a new high-grade gold occurrence below the Father’s Day Vein at its Beta Hunt Mine in southern Australia. RNX announced that it has recovered nearly 1,000 ounces of coarse gold in 238 kilograms of rock from a series of veins. The market was clearly positively surprised by the RNX news as it sent RNX shares ~25% higher after the stock resumed trading following a trading halt:
RNX.TO (Daily)

After experiencing a breathtaking parabolic rise from C$.09 to C$1.18 last September, RNX has spent much of the last nine months either trading lower or sideways. The recent rally has pushed RNX back above its rising 50-week moving average and there is a real chance that a long term bottom has finally been put in place.
After the discovery of the Father’s Day Vein (FDV) last September it took a while for market expectations to get back in line with reality. Now that sentiment on RNX has moderated a bit and the early discovery hype has dissipated, the stage could be set for a sustained move higher in RNX shares. There are two key levels just overhead, C$.55 and $.60, and a weekly close above C$.60 would likely lead to a 'filling in' of the open gap from February up at C$.72. In my estimation RNX shares have ~40% of near term upside potential vs. ~20% of downside risk, not the worst odds i've ever seen.
A couple of stocks that I mentioned in last week’s weekly wrap, Benchmark Metals (TSX-V:BNCH) and Brixton Metals (TSX-V:BBB), both delivered big share price gains last week (BBB +21%, BNCH +33%) in addition to noteworthy news releases:
BBB.V (Daily)

On Thursday morning, Brixton announced the beginning of drilling of a 1,000 meter deep hole at its Thorn Project in Northwest British Columbia. In addition, Brixton announced that its recently completed airborne magnetic survey of its Atlin Goldfields Project was successful in identifying a large number of geophysical anomalies and features.
BNCH.V (Daily)
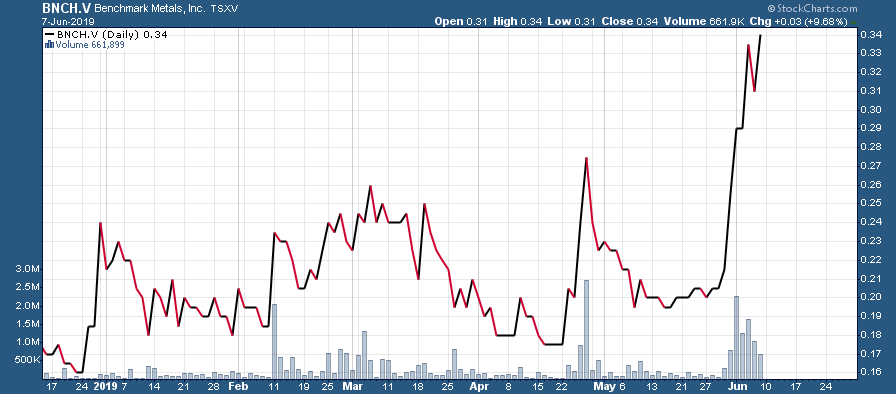
Benchmark had a busy week of news releases which included multiple historical assay results citing bonanza gold grades in the “Amethyst Breccia Zone” (AGB Zone) at its Lawyers Project in the Golden Triangle.
In its June 4th NR Benchmark stated “Significant mineralization was intersected by historic drilling outside of the main mined area. The AGB zone remains open in all directions. Recently acquired data, geological compilation and reinterpretation for the AGB zone has revealed significant potential to add gold and silver ounces in unmined areas. This is based upon data incorporated from over 17,000 metres of drilling, 4,500 assays from surface and underground sampling, in addition to more than 600 metres of trench data with more than 600 samples and assays.”
The AGB Zone is now a high-priority target for an expanded property-scale work permit in 2019.
The tide appears to have turned in the junior mining sector and optimism is steadily returning to the sector. The following chart shows how the Fed Funds Futures market has already priced in 50 basis points of rate cuts and if you look closely you can see that the last time the market moved ahead of the Fed (in terms of easing policy) was at the end of 2007:

Historically, one of the best times to be a precious metals investor has been when the Fed is beginning to ease policy. Especially when the Fed is behind the curve so to speak, and is being forced to catch up by implementing drastic rate cuts and/or quantitative easing measures. This appears to be one of those times.
I will conclude this week’s Wrap with the monthly chart of US dollar gold:
Gold (Monthly)

Depending on who you talk to and what time frame they’re referring to, gold is either forming a head & shoulders bottom, an ascending triangle, or a cup & handle. All could be true but it doesn’t really matter. US$1,380 is the breakout level on the monthly chart and a confirmed breakout above this level will likely target US$1,500+ in what will likely be a relatively swift move higher.
Since the December 2015 low at US$1,045 gold has made a series of higher lows, however, it has consistently run into resistance above US$1,360. With gold ending last week barely more than 1% away from this layer of resistance the stage is set for a big test at some point this summer. It may not be this coming week, but it seems inevitable that resistance will be tested again. Markets have a way of building up potential energy and then releasing it in unexpected ways - the April 2013 gold crash was an example of this phenomenon as support near US$1,550 was tested repeatedly before finally snapping in spectacular fashion on a thin Sunday night futures trading session. With so much energy built up below the $1,360-$1,380 resistance zone the odds are increasingly favoring an upside breakout scenario.
Get CEO.CA/Pro for better trades. Plans from $50/month. Cancel anytime.
Disclosure: Author is long BBB.V, BNCH.V, and MAI.V at the time of publishing this article and may choose to buy or sell at any time without notice.
DISCLAIMER: The work included in this article is based on current events, technical charts, company news releases, and the author’s opinions. It may contain errors, and you shouldn’t make any investment decision based solely on what you read here. This publication contains forward-looking statements, including but not limited to comments regarding predictions and projections. Forward-looking statements address future events and conditions and therefore involve inherent risks and uncertainties. Actual results may differ materially from those currently anticipated in such statements. The views expressed in this publication and on the EnergyandGold website do not necessarily reflect the views of Energy and Gold Publishing LTD, publisher of EnergyandGold.com. This publication is provided for informational and entertainment purposes only and is not a recommendation to buy or sell any security. Always thoroughly do your own due diligence and talk to a licensed investment adviser prior to making any investment decisions. Junior resource companies can easily lose 100% of their value so read company profiles on www.SEDAR.com for important risk disclosures. It’s your money and your responsibility.
