Last year at this time gold had just completed a terrific four week run, rallying nearly $200/oz (~18%) from the low on January 14th, 2016 to the high on February 11th, 2016. After briefly topping $1260 gold ended the second week of February 2016 at $1238.50, not far from this week's closing level of $1235.90. Not only is the price of gold at almost exactly the same level as it was last year at this time, the technical backdrop is strikingly similar:
Gold (Weekly)

The weekly 14-period Relative Strength Index has broken above the median line and it is pointing higher just as it was last year. In addition, gold made a MACD bull crossover last week from a very similar place as it did last year.
Gold ended the week at $1235.90 after trading as high as $1246.60 on Wednesday. From my perspective this was a very positive week for gold for a number of reasons:
- Gold took out the $1220 resistance level and closed above $1230 on a weekly closing basis.
- Gold miners up for the 8th consecutive week while continuing to outperform the metal itself.
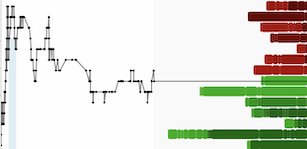
- Often when we see gold rally above key technical levels we will see a large increase in net speculative length in the CoT data, however, in the most recent CoT report we saw a nice jump in open interest while net speculative length was essentially unchanged (with a 6,000 contract jump in the large spec short position which could serve as potential fuel for more upside in the future as these positions will be covered eventually):

This is a positive sign as gold was able to rally ~$25/oz while taking out a key technical level ($1220) which had served as resistance with very little futures buying. This could indicate that some of the recent rally was driven by physical gold buying - a positive because speculative futures trading is 'hot money', longs can quickly become sellers, while physical gold buyers are longer term and unlikely to turn sellers anytime soon.
- From a sentiment standpoint it's also beginning to feel a lot like 2016; a lot of the sentiment data that I look at is beginning to show some optimism but not the kind of euphoria that generates major tops. In the junior gold mining space we started to see some early bursts of euphoria Wednesday morning, however, before the bulls could get too lathered up gold mining shares began to pull back.
It's starting to feel a lot like 2016, and if you're bullish on precious metals and mining shares that's a good thing. ~$1250 is certainly a big level for gold given the sheer amount of technical confluence around that level, however, if the script plays out similar to 2016 a 1-2 week consolidation should give way to the next leg higher which will target $1310. Then we can begin to worry about the Ides of March (March is the worst month of the year historically for gold)....
DISCLAIMER: The work included in this article is based on current events, technical charts, and the author’s opinions. It may contain errors, and you shouldn’t make any investment decision based solely on what you read here. This publication contains forward-looking statements, including but not limited to comments regarding predictions and projections. Forward-looking statements address future events and conditions and therefore involve inherent risks and uncertainties. Actual results may differ materially from those currently anticipated in such statements. The views expressed in this publication and on the EnergyandGold website do not necessarily reflect the views of Energy and Gold Publishing LTD, publisher of EnergyandGold.com. This publication is provided for informational and entertainment purposes only and is not a recommendation to buy or sell any security. Always thoroughly do your own due diligence and talk to a licensed investment adviser prior to making any investment decisions. Junior resource companies can easily lose 100% of their value so read company profiles on www.SEDAR.com for important risk disclosures. It’s your money and your responsibility.


