


IMPORTANT CAVEAT: This post is solely about the technical price action/chart of Novo Resources (TSX-V:NVO), NOT the fundamentals. It is only a study of price and volume behavior of the NVO stock chart. If you don't believe charts have any value, or the behavior of market participants isn't worth studying then please DO NOT READ this post.
Now with that out of the way lets get to business.
There hasn't been much to comment on regarding the Novo Resources chart recently, however, I was looking at the NVO chart this evening and several things stood out to me.
NVO.V (Daily)
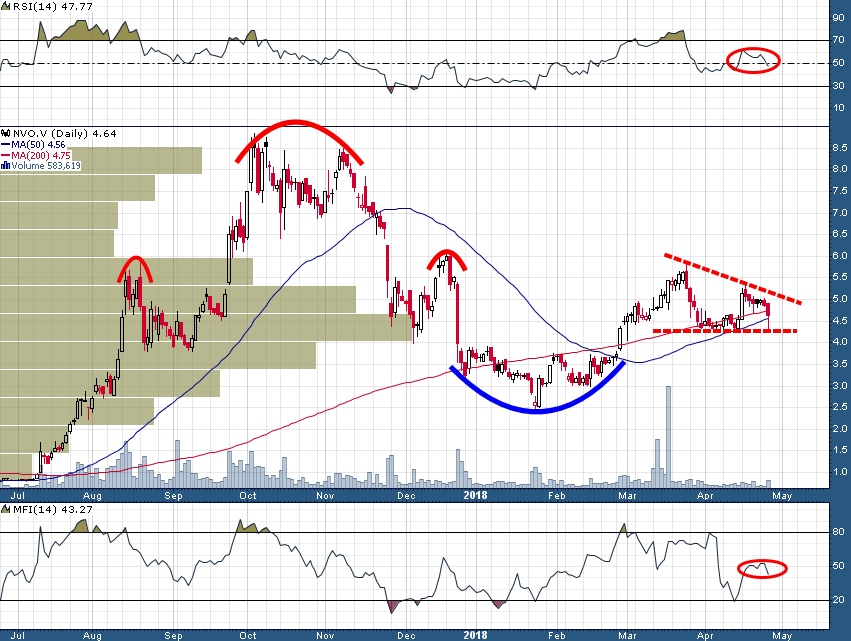
First of all, the importance of the support in the C$4.30s was exhibited yet again today when NVO was under pressure early in the trading session (this support level has now become critical). Second, momentum indicators such as RSI and MFI have topped and are now beginning to point lower (this is a clear sign of a stock that is weakening and beginning to come under distribution). Third, the buying pressure between February 14th and March 23rd which drove NVO from C$3.00 to C$5.84 was arguably greater than the buying pressure between September 11, 2017 and October 4, 2017 which drove NVO from C$3.80 to C$8.83 - given that the September/October 2017 rally was of a much greater magnitude this is a sign that there is an increasing quantity of overhead supply at lower levels than existed in September/October 2017.
A couple of other key points to make note of:
- An enormous amount of volume has been churned around the C$4.50 level since last August, this level has become the high volume-by-price bar and has begun to act as a sort of price 'magnet' - the next significant directional move away from this level is likely to result in an outsized move.
- A descending triangle has formed since mid-March with a lower boundary at C$4.30 and an upper boundary currently near C$5.25. Descending triangles have a slightly greater tendency to resolve to the downside, however, the pattern can absolutely break either way. A break below C$4.30 would likely target a move back down to at least the C$3.00 level, whereas, an upside resolution (above C$5.25) would initially target a test of the C$6.00 level followed by a gap fill up at C$6.65.
If we tune out all the noise and distill the story to the price & volume action in the chart we have a very straightforward story: A stock that went on a parabolic rise between July and October of last year only to hammer out a substantial top over the next six weeks (up until November 23rd before the large downside break began), NVO has made a series of lower highs since the October 4, 2017 all-time high at C$8.83, and while there are a series of higher lows intact since the January 2018 low at C$2.45, the situation is now coming to a head at MAJOR support near C$4.30 - should C$4.30 support get broken decisively over the coming days/weeks the situation would become rather bleak for NVO on multiple time frames.
This is how I objectively view the NVO chart at this point in time. I currently do not have a position in NVO shares.
DISCLAIMER: The work included in this article is based on current events, technical charts, and the author’s opinions. It may contain errors, and you shouldn’t make any investment decision based solely on what you read here. This publication contains forward-looking statements, including but not limited to comments regarding predictions and projections. Forward-looking statements address future events and conditions and therefore involve inherent risks and uncertainties. Actual results may differ materially from those currently anticipated in such statements. The views expressed in this publication and on the EnergyandGold website do not necessarily reflect the views of Energy and Gold Publishing LTD, publisher of EnergyandGold.com. This publication is provided for informational and entertainment purposes only and is not a recommendation to buy or sell any security. Always thoroughly do your own due diligence and talk to a licensed investment adviser prior to making any investment decisions. Junior resource companies can easily lose 100% of their value so read company profiles on www.SEDAR.com for important risk disclosures. It’s your money and your responsibility.
