


I often see people post charts with what seems like a million lines drawn all over them. I don't know how they use these charts and whether they are really of any value. If it works for them then great, but I know that I prefer things to be simpler and cleaner.
As far as gold is concerned I've seen people throw out all sorts of price levels as being important or levels which "gold must get above" or "stay above" - to me the situation is fairly straightforward; gold is in a secular long term uptrend and since August 2011 it has been in a corrective phase within the context of this much longer term uptrend.
There is a very good chance that gold put in a major low at $1045 in December 2015 and there is also a good chance that gold put in a higher low at $1124 in December 2016:
Gold (Weekly - 12 year)
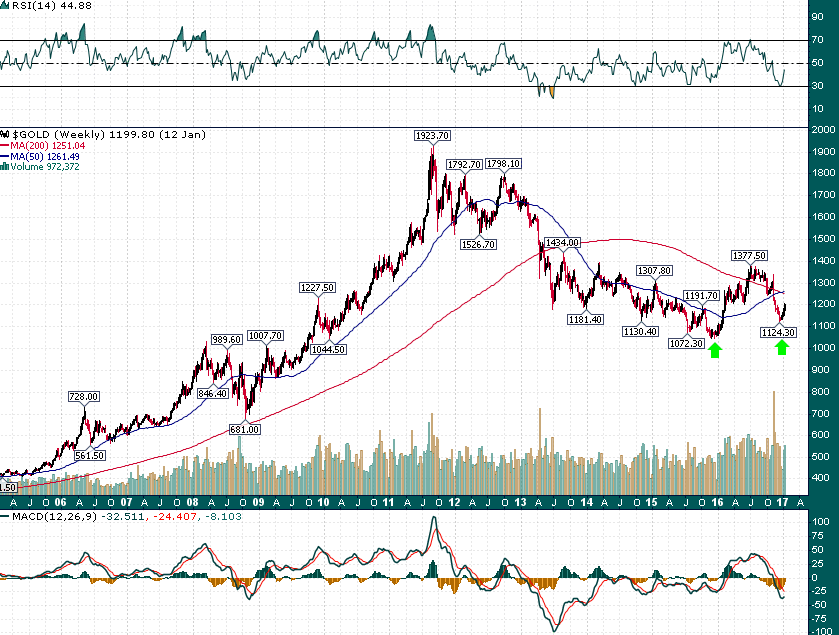
The only question that really matters in terms of levels is, above which level will we have strong evidence that $1124 really was a low of great significance and the chances are much higher that we have resumed the much longer term uptrend?
For me it's interesting that both the 50-week moving average (blue) and 200-week moving average (red) are converging near $1250. Looking at a daily chart and using two simple Fibonacci retracements we can also quickly deduce the importance of the $1250 level:
Gold (Daily)
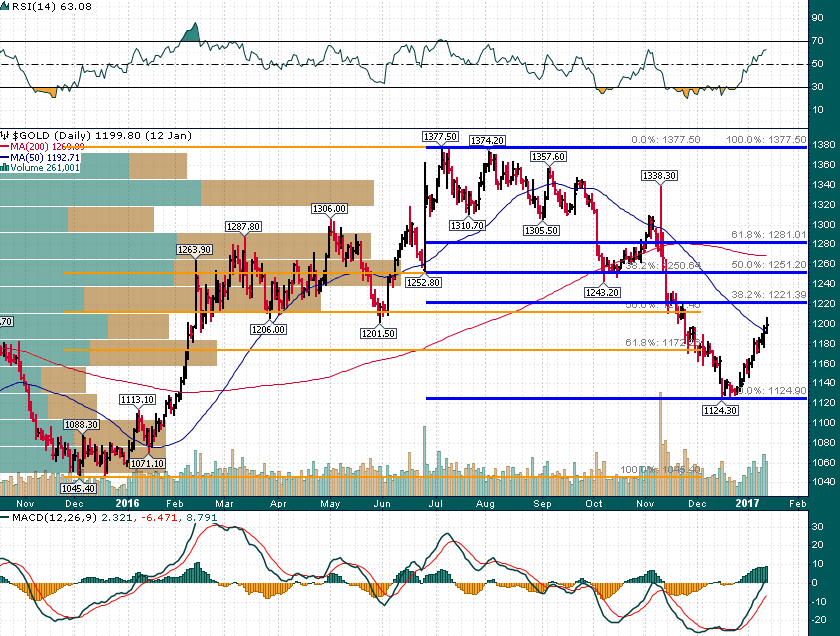
The 38.2% retracement of the $1045->$1377 rally and the 50% retrace of the $1377->$1124 decline coincide near $1250. Moreover, the ~$1250 area represents the largest volume-by-price bar since the December 2015 low.
A level is just that, a level. And if there is one single level that is of maximum relevance to gold in US dollar terms right now it would be $1250. A rally back above $1250 will likely send gold shares soaring as investor confidence in the precious metals sector comes back and trend followers begin piling back into gold and mining shares.
The $1250 level is also of great significance from a mining cost standpoint as the 90th percentile of all-in cost of gold extraction is currently in the low $1200s which means that above $1250 gold miner profitability increases dramatically.
DISCLAIMER: The work included in this article is based on current events, technical charts, and the author’s opinions. It may contain errors, and you shouldn’t make any investment decision based solely on what you read here. This publication contains forward-looking statements, including but not limited to comments regarding predictions and projections. Forward-looking statements address future events and conditions and therefore involve inherent risks and uncertainties. Actual results may differ materially from those currently anticipated in such statements. The views expressed in this publication and on the EnergyandGold website do not necessarily reflect the views of Energy and Gold Publishing LTD, publisher of EnergyandGold.com. This publication is provided for informational and entertainment purposes only and is not a recommendation to buy or sell any security. Always thoroughly do your own due diligence and talk to a licensed investment adviser prior to making any investment decisions. Junior resource companies can easily lose 100% of their value so read company profiles on www.SEDAR.com for important risk disclosures. It’s your money and your responsibility.
