


Market sentiment is an important tool, however, taken in isolation it is far from a reliable market timing tool. Moreover, during strong trends markets will continue to make higher highs/lower lows as sentiment remains at overbullish/overbearish extremes. The recent case of gold is a textbook example of a market reaching a bearish sentiment extreme and remaining there for weeks while price continues to drift sideways/lower:
Gold (Daily)
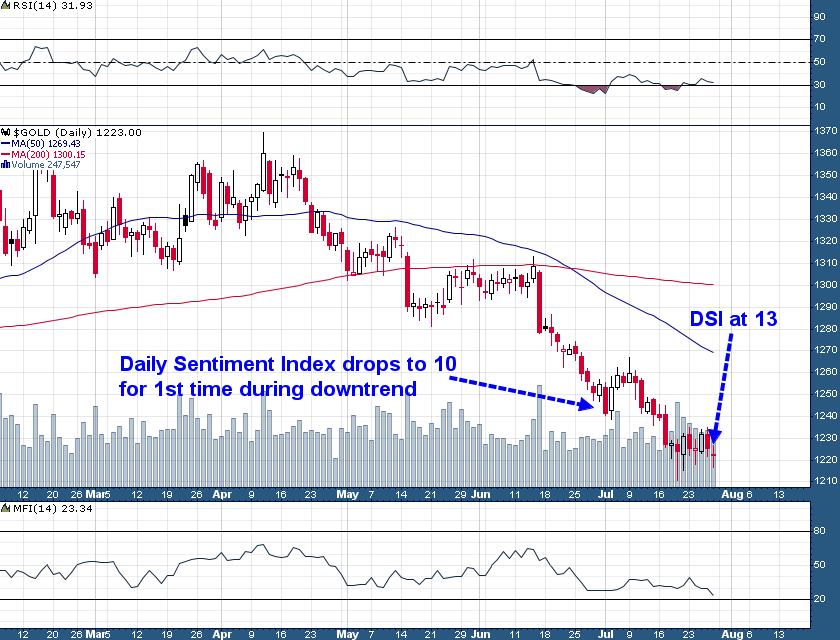
The reason sentiment isn't an accurate timing tool is that for price to reverse it requires market participants to begin changing their minds, something which typically takes weeks or months to occur. Gold has been mired near 10 on the Daily Sentiment Index (DSI) for the last month while price has continued grinding lower (from ~$1250 at the end of June to $1223 at Friday's close), this has also taken place while all sorts of other data (CoTs, fund manager surveys, etc.) indicate that gold is at a bearish sentiment/positioning extreme.
This is what happens during bear market trends: Everything gets extreme, sentiment sucks, early bottom callers get chewed up, and then finally when it's least expected and nobody believes it's real, the market bottoms and moves sharply higher.
As a market participant that utilizes technical analysis (even if occasionally) it is important to determine whether a given market is trending or oscillating (mean reverting). If you can answer this question correctly then you are 90% of the way to being a profitable market participant and making effective decisions in the market. In oscillating market conditions sentiment is far more useful as a timing tool because you know that when the boat fills up too much to one side things are about to tip the other way. However, in trending markets you're going to see sentiment near extreme levels for extended periods of time as price continues to move in the direction of the controlling trend.
I'm going to give you a little secret now. This simple tool is very effective in determining whether a particular market/asset class/stock is trending or oscillating, it's not 100%, nothing is, but it's as good as anything i've seen.
The daily 14-period RSI (Relative Strength Index) is very effective in helping to determine if a market is in a strong trending environment, or in an oscillating environment. During the strongest uptrends the RSI will remain above the median line for extended periods of time and even during pullbacks/corrections the RSI typically won't drop far below the median line. The same thing is true for downtrends, the RSI will stay submerged below the median line for extended periods of time and rallies will usually tend to run out of fuel as they touch the median line from underneath. You can see this is true in the gold chart above; RSI broke below the median line as gold began to trend down at the end of April and it hasn't managed to get back above it since.
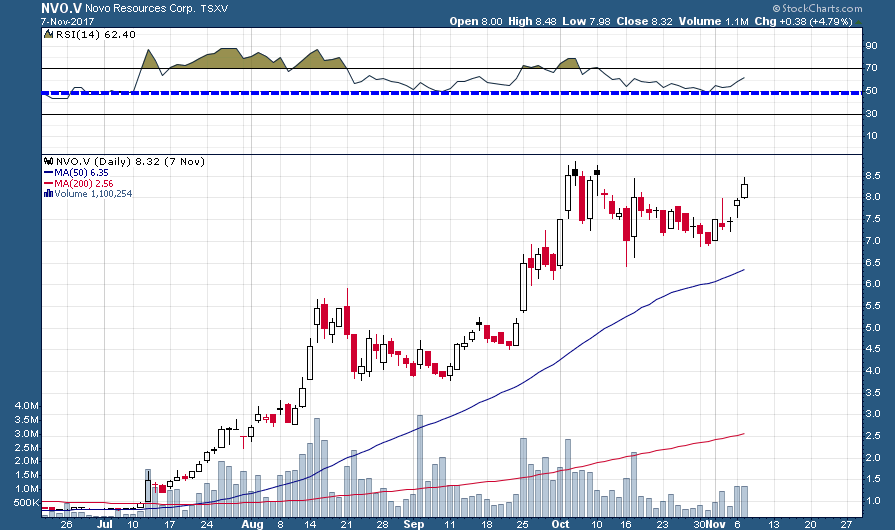
The strongest uptrends will typically see RSI in 'overbought' territory (above 70) for extended periods of time with pullbacks typically coming to an end near the median line (50) - the Novo Resources (TSX-V:NVO) chart between June and November 2017 is a perfect example of what a roaring bull market looks like:
NVO.V (Daily)
In summary, if we have a good indication that the market we are analyzing is in a trending environment it will require more than an analysis of sentiment to effectively time a turn in the market. The current situation in precious metals is interesting from a sentiment/technical analysis standpoint - there are a number of factors which would indicate a "tradable rally" could begin any day. However, buying strength has been weak and rallies have consistently fizzled out after a couple of days. I think there is a good chance that we will need to see a deeper capitulation before a sustainable low is in place, that capitulation could take place next week or a month from now.
DISCLAIMER: The work included in this article is based on current events, technical charts, and the author’s opinions. It may contain errors, and you shouldn’t make any investment decision based solely on what you read here. This publication contains forward-looking statements, including but not limited to comments regarding predictions and projections. Forward-looking statements address future events and conditions and therefore involve inherent risks and uncertainties. Actual results may differ materially from those currently anticipated in such statements. The views expressed in this publication and on the EnergyandGold website do not necessarily reflect the views of Energy and Gold Publishing LTD, publisher of EnergyandGold.com. This publication is provided for informational and entertainment purposes only and is not a recommendation to buy or sell any security. Always thoroughly do your own due diligence and talk to a licensed investment adviser prior to making any investment decisions. Junior resource companies can easily lose 100% of their value so read company profiles on www.SEDAR.com for important risk disclosures. It’s your money and your responsibility.

