By JC Parets, Editor, AllStarCharts.com

At this point, prices have now rallied back up and crossed above the upper of these two converging trend lines since 2013. If you are a longer-term investor, we would only own gold on its own if it is above the upper of these two trendlines. If that is indeed the case, I believe we can get back up above 1500, which was support in 2011 and 2012 before ultimately breaking down in 2013. Above 1500 is the next stop, and eventually a retest of the all-time highs is in the cards. Risk management-wise, there is no reason to be long Gold from a structural perspective if it is below that downtrend line from April 2013.
Looking shorter-term you can see that in November prices started to consolidate in a very traditional continuation pattern and this consolidation continued into January. When traditional bearish patterns resolve positively, the market is speaking and there are larger forces at work. This rally above $1080 was the catalyst we wanted in order to get long for a tactical trade, but all of our upside objectives have already been met based on former support and resistance going back to 2014:

At this point, I would look for some consolidation and digestion of these gains before reentering tactically or look for a pullback under 1180. The fact that the 200 day moving average has gone from downward sloping to upward sloping is a huge positive and it changes the structure of this asset class.
Silver, on the other hand, has really been destroyed since its peak in 2011. Not only did Silver top out 6 months prior to Gold, but it fell over 70% compared to “just” a 45% crash in Gold prices during that same period. This has clearly been the weak link in the precious metals. I think it’s worth noting that we have come down to interesting levels that have served as resistance in 2006-2007 and support in 2010 and 2014. There is a lot of market memory near these levels suggesting a counter-trend bounce has begun:

Let’s remember that we have only seen enough evidence to believe this rally is just a tactical move higher within an ongoing structural bear market. I would focus more on the daily timeframe in Silver.
Here is a daily chart of Silver showing a similar bearish continuation pattern from November through January that resolved to the upside, instead of in the direction of the underlying trend. Like in Gold, when traditional bearish patterns resolve positively, the market is speaking and there are larger forces at work. The breakout became the catalyst for us to get long and our upside targets near 15.50 were hit the past week. This area represents major support since 2014 and there is a lot of market memory here:

At this point, Silver is struggling with this uptrend line from the 2014 lows. I would expect some sort of consolidation here which would allow the 200 day moving average to begin to slope higher, similar to what we’re already seeing in Gold. Moving forward I would only be long if we’re above that broken uptrend line from the 2014 lows and neutral tactically if we’re below it. I think we can see 18.50 very soon if we can manage to stay above last week’s highs:
Looking at Gold and Silver against each other, the trend here is still Gold outpacing Silver. We are right in the middle of a multi-year uptrend channel well-defined by these two parallel trendlines. Until the lower of these two uptrend lines breaks, the uptrend is still Gold over Silver:

Next we’re taking a look at Gold Miners. I think we could have just seen a massive failed breakdown below the 2008 lows. Last Summer prices broke down to new lows and consolidated around there for 6 months. Over the last couple of weeks, prices are now back above both the downtrend line from the 2012 highs and former support from the 2008 lows:

Going forward structurally I would only own Gold Miners $GDX if we are above both the downtrend line form the 2012 highs and former support from 2008. I think we can see $32-33 which represents a filling of the gap in early 2013 and the 38.2% Fibonacci retracement of the entire 2011-2016 decline.
Looking shorter-term, that failed breakdown last month was text book. Originally we wanted to get aggressively long only if prices were above $13.20. This sparked a huge rally but at this point all of our tactical upside objectives have been met. I would expect more selling and consolidation of these gains moving forward and would wait for this to play itself out before reentering any long positions. The weekly timeframe in this particular asset tells the better story:

Next we want to compare Gold to other asset classes. The first chart compares it to the rest of commodities. This is Gold relative to the CRB Commodities Index. We broke out last month from a 4-year basing period. Some might call this an inverse head & shoulders continuation pattern. Out 2 point measured move target based on the amplitude of this consolidation gives us a target just above 8:1. We are quickly approaching this now:

Next is Gold compared with the S&P500. Here we are looking at a multi-year downtrend channel well-defined by two parallel trendlines. We are now breaking out and a new trend has emerged. I would continue to buy gold and short the S&P500 against it as long as this ratio remains above the upper of these two parallel trendlines. We still like gold over stocks:

Here is Gold relative to the MSCI World Index (ex-USA). In other words, this is the price of Gold compared to the stocks around the world minus the US. We can see prices finding a bottom last year at exactly the 61.8% Fibonacci retracement of the entire 2000-2011 rally. We are now towards the upper of these two converging trend lines and would be a buyer if we are above it. Based on the bullish momentum divergence at last year’s lows and recent overbought conditions, I would expect this breakout to take place soon. We want to buy that:

Here is Gold relative to Copper. As I like to call it: Precious metals vs base metals. We’ve wanted to buy this pair where we are long gold and short copper since that breakout to start the year. I would be taking profits on this pair near the 2009 highs above 700:1

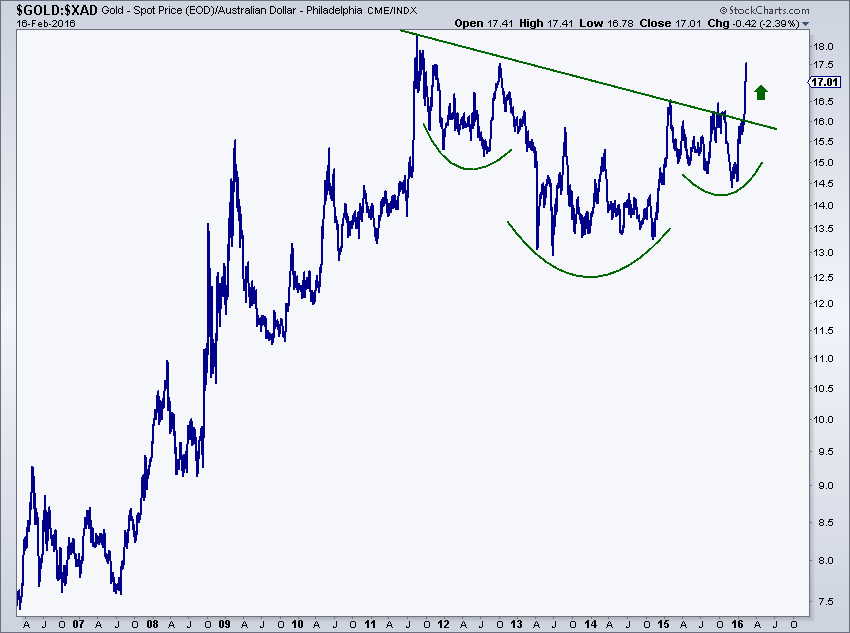
Most people like to look at gold priced in U.S. Dollars. I personally think it’s a bit silly to limit yourself to just one denominator? Why would you do that? Anyway, here is gold breaking out of a massive base when priced in Australian Dollars. Rather than shorting U.S. Dollars when you buy gold, you would short Aussie against it instead. The side of this base gives us a measured move target near 21.50, which is still another 25% higher:

Here is Gold priced in Canadian Dollars doing something very similar. We are seeing a massive breakout from a huge base giving us a measured move target just above 22:

I think we are seeing some really interesting things in the Gold Market. These are things and behavior that we have not seen in half a decade. I like making fun of gold bugs as much as the next guy. Their lack of risk management over the past 5 years clinging to their “story” is one to watch from the sidelines and learn from. It is irresponsible and not something we would ever do. Now, at this point, we have to recognize that the data has changed so therefore we must change our stance. Rather than looking to sell into rips and shorting precious metals and precious metal companies, we want to be buyers of dips and buyers of consolidations until further notice.
Cheers,
JC
JC Parets is the founder of AllStarCharts.com, one of the Internet's most popular newsletters about technical analysis and trading. Follow JC on Twitter here.


