


Roxgold Inc. (“Roxgold” or the “Company”) (TSX: ROXG) (OTC: ROGFF) is pleased to report an updated Mineral Resource and Mineral Reserve Estimate for the Yaramoko Mine Complex (“Yaramoko”) located in Burkina Faso. Total Proven and Probable Mineral Reserves increased by 8% to 710,000 ounces of gold replacing depletion of 207,396 ounces during the period from December 31, 2018 to June 30, 2020. Measured and Indicated Mineral Resources increased 4% to 857,000 ounces of gold – increasing the total gold in Measured and Indicated Mineral Resources plus the cumulative production to date to approximately 1.4 million ounces over the life of the project. The increased Mineral Reserves reinforces the project as a stable foundation of long-term production and free cash flow generation for Roxgold’s ambitious growth plans.
This press release features multimedia. View the full release here: https://www.businesswire.com/news/home/20201110005408/en/
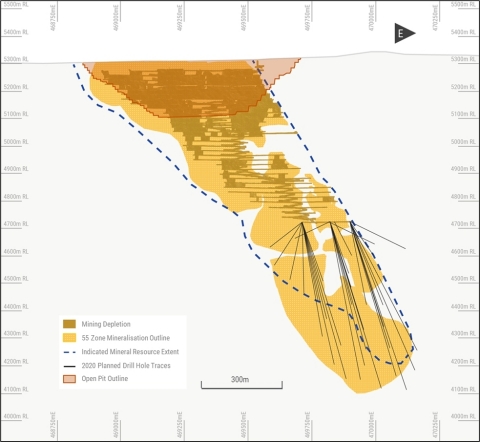
Fig 2. 55Z Long-section
Highlights:
- Total Proven and Probable Mineral Reserves at Yaramoko increased 8% to 710,000 ounces of gold (“oz Au”), net of mining depletion of 207,396 oz Au, from the period of December 31, 2018 to June 30, 2020
- Measured and Indicated Mineral Resources at Yaramoko increased 4% to 857,000 oz Au, increasing the mineral endowment of Measured and Indicated Mineral Resources plus cumulative production to date at Yaramoko to 1.4 million ounces
- The addition of near-surface Mineral Reserves and Mineral Resources highlights the plan for an open pit operation to complement the underground mine and extend the mine life at the 55 Zone
- The 14,500m underground drill program has commenced in the 55 Zone at the 4754 Level targeting the replacement and upgrading of Inferred Mineral Resources down to the 4170 Level, approximately 1,200m below surface
- A regional exploration program has commenced targeting additional near-surface mineralization opportunities across the Yaramoko Permit targeting multiple early-stage opportunities which have been identified including the significant mineralized footprint around the operating Bagassi South underground mine
“Since starting production in 2016, the Yaramoko Mine Complex has poured over 575,000 ounces of gold and continues to demonstrate its ability to replace production and maintain a long mine life,” stated John Dorward, President and CEO. “Earlier this year we initiated a review of near-surface mineralization opportunities across the Yaramoko property to complement our high-grade underground operations. This review identified the near-surface portions of 55 Zone that extended outside of the prior underground Mineral Resource. With today’s announcement, we are planning for an open pit operation with a reserve grade of over 7g/t to complement the high-grade underground operation and extend the mine life at the 55 Zone.
This is just the first phase in our near-term plans to continue to explore additional mine life opportunities at Yaramoko. This month we initiated a 14,500m underground drill program at the 55 Zone which is designed with the intention of upgrading and extending mineral resources at depth to approximately 1,200m below surface. The results of this program will be incorporated into the Annual Mineral Resource and Reserves update to be released mid next year. Extending the mine life at Yaramoko has long been a priority for us and between the success of near-surface drilling program, together with our recently commenced underground drilling program and the prioritisation of regional exploration targets, I am confident that we will build a compelling body of evidence over the coming quarters to showcase the long-life nature of Yaramoko.”
Proven and Probable Mineral Reserves at Yaramoko increased 8% to 710,000 oz Au, net of mining depletion of 207,396 oz Au at an average processed head grade of 9.2 g/t, from the period of December 31, 2018 to June 30, 2020. Measured and Indicated Mineral Resources increased 4% to 857,000 oz Au from 827,000 oz Au relative to the December 31, 2018 estimate (refer to Company press release dated July 11, 2019 for further details with respect to the December 31, 2018 estimates).
The increase in Mineral Reserves and Measured and Indicated Mineral Resources is primarily attributed to the success of a prior drilling program that delineated mineralization in the near-surface portion of the 55 Zone, intersecting several high grade intervals close to surface and above zones previously mined from underground in the early stages of the 55 Zone mining operation. The objective of this drill program was to determine the potential for an open pit operation to complement the high-grade underground operation and extend the mine life at the 55 Zone (refer to Company press release dated September 30, 2020).
Inferred Mineral Resources decreased 37% from 191,000 oz Au to 121,000 oz Au as per the December 31, 2018 estimate. The decrease in the Inferred Mineral Resources is primarily due to the conversion of prior Inferred Mineral Resources to Indicated Mineral Resources with the extension of Inferred Mineral Resources to be a priority for upcoming underground drilling campaigns.
The Mineral Resources and Mineral Reserves models were prepared in conformity with The Canadian Institute of Mining, Metallurgy and Petroleum’s (CIM) Estimation of Mineral Resources and Mineral Reserves Best Practices Guidelines (November, 2019) and are classified per the CIM Definition Standards for Mineral Resources and Mineral Reserves (May, 2014).
Table 1 – Yaramoko Mineral Reserve Statement Summary
|
Yaramoko June 2020 Mineral Reserve Estimate |
||||||||
|
Proven |
Probable |
Proven & Probable |
||||||
Tonnes |
Grade |
Metal |
Tonnes |
Grade |
Metal |
Tonnes |
Grade |
Metal |
|
(kt) |
(g/t Au) |
(000 oz) |
(kt) |
(g/t Au) |
(000 oz) |
(kt) |
(g/t Au) |
(000 oz) |
|
Stockpiles |
131 |
3.4 |
14 |
- |
- |
- |
131 |
3.4 |
14 |
55 Zone |
|
|
|
|
|
|
|
|
|
Open pit |
- |
- |
- |
820 |
7.2 |
190 |
820 |
7.2 |
190 |
Underground |
262 |
6.0 |
51 |
1,354 |
7.2 |
314 |
1,616 |
7.0 |
365 |
Bagassi South |
|
|
|
|
|
|
|
|
|
Underground |
- |
- |
- |
576 |
7.6 |
141 |
576 |
7.6 |
141 |
Total |
393 |
5.1 |
65 |
2,750 |
7.3 |
645 |
3,143 |
7.0 |
710 |
Notes: |
(1) Mineral Reserves are reported in accordance with NI 43-101 with an effective date of June 30, 2020, for the Yaramoko Gold Mine. |
(2) The Yaramoko Mineral Reserves are reported on a 100% basis at a gold grade cut-off of 0.9g/t Au for the 55 Zone open pit, 3.1g/t Au for 55 Zone underground and 2.8g/t Au for Bagassi South Underground, based on a gold price of US$1,500/ounce. Reported Mineral Reserves account for mine depletion and stockpile activities as at June 30, 2020. |
(3) The Yaramoko Underground Mineral Reserve Statement was prepared under the supervision of Mr. Ashraf Suryaningrat, Senior Mine Engineer at Roxgold Inc. Mr. Suryaningrat is a Qualified Person as defined in NI 43-101. |
(4) The Yaramoko Open pit Mineral Reserve Statement was prepared under the supervision of Mr. David Whittle, General Manager - Yaramoko at Roxgold Inc. Mr. Whittle is a Qualified Person as defined in NI 43-101. |
(5) All figures have been rounded to reflect the relative accuracy of the estimates and totals may not add due to rounding. |
(6) The Yaramoko Gold Project is subject to a 10% carried interest held by the government of Burkina Faso |
Table 2 – Yaramoko Mineral Resource Statement Summary
|
Yaramoko June 2020 Mineral Resource Estimate |
|
|||||||||||||
|
Measured |
Indicated |
Measured & Indicated |
Inferred |
|
||||||||||
Tonnes |
Grade |
Metal |
Tonnes |
Grade |
Metal |
Tonnes |
Grade |
Metal |
Tonnes |
Grade |
Metal |
|
|||
(kt) |
(g/t Au) |
(000 oz) |
(kt) |
(g/t Au) |
(000 oz) |
(kt) |
(g/t Au) |
(000 oz) |
(kt) |
(g/t Au) |
(000 oz) |
|
|||
Stockpiles |
131 |
3.4 |
14 |
- |
- |
- |
131 |
3.4 |
14 |
- |
- |
- |
|
||
55 Zone |
|
|
|
|
|
|
|
|
|
|
|
|
|
||
Open pit |
- |
- |
- |
972 |
7.7 |
240 |
972 |
7.7 |
240 |
202 |
4.4 |
29 |
|
||
Underground |
220 |
9.5 |
67 |
894 |
12.4 |
356 |
1,115 |
11.8 |
423 |
178 |
8.1 |
46 |
|
||
Bagassi South |
|
|
|
|
|
|
|
|
|
|
|
|
|
||
Underground |
- |
- |
- |
436 |
12.9 |
180 |
436 |
12.8 |
180 |
176 |
8.1 |
46 |
|
||
Total |
351 |
7.2 |
81 |
2,303 |
10.5 |
776 |
2,654 |
10.0 |
857 |
556 |
6.8 |
121 |
|
||
Notes: |
(1) Mineral Resources are reported in accordance with NI 43-101 with an effective date of June 30, 2020, for the Yaramoko Gold Mine. |
(2) The Yaramoko Mineral Resources are reported on a 100% basis at a gold grade cut-off of 0.5g/t Au for the 55 Zone open pit and 2.7g/t Au for underground, based on a gold price of US$1,700/ounce; with the 55 Zone open pit constrained to an MII pit optimisation shell. Reported Mineral Resources account for mine depletion and stockpile activities as at June 30, 2020. |
(3) The identified Mineral Resources are classified according to the “CIM” definitions for the Measured, Indicated, and Inferred categories. The Mineral Resources are reported in situ without modifying factors applied. |
(4) The Yaramoko Mineral Resource Statement was prepared under the supervision of Mr. Hans Andersen, Senior Resource Geologist at Roxgold Inc. Mr. Andersen is a Qualified Person as defined in NI 43-101. |
(5) All figures have been rounded to reflect the relative accuracy of the estimates and totals may not add due to rounding. |
(6) Mineral Resources that are not Mineral Reserves do not necessarily demonstrate economic viability. |
(7) Mineral Resources are reported inclusive of Mineral Reserves |
(8) The Yaramoko Gold Project is subject to a 10% carried interest held by the government of Burkina Faso |
Figure 1. Yaramoko Measured and Indicated Resources & Cumulative Production
Table 3 – Yaramoko Mineral Resource and Reserve Comparison1,2
|
PRIOR as at Dec. 31, 20183 |
|
UPDATED
|
|
|
||||
|
Tonnes |
Grade |
Metal |
|
Tonnes |
Grade |
Metal |
|
% Change
|
(kt) |
(g/t Au) |
(000 oz) |
|
(kt) |
(g/t Au) |
(000 oz) |
|
||
Mineral Reserve |
|
|
|
|
|
|
|
|
|
Proven |
558 |
8.2 |
147 |
|
393 |
5.1 |
65 |
|
-56% |
Probable |
1,926 |
8.3 |
511 |
|
2,750 |
7.3 |
645 |
|
+26% |
Proven & Probable |
2,484 |
8.2 |
658 |
|
3,143 |
7.0 |
710 |
|
+8% |
Mineral Resource |
|
|
|
|
|
|
|
|
|
Measured |
542 |
11.9 |
208 |
|
351 |
7.2 |
81 |
|
-61% |
Indicated |
1,580 |
12.2 |
619 |
|
2,303 |
10.5 |
776 |
|
+25% |
Measured & Indicated |
2,122 |
12.1 |
827 |
|
2,654 |
10.0 |
857 |
|
+4% |
Inferred |
477 |
12.4 |
191 |
|
558 |
6.7 |
121 |
|
-37% |
Notes: |
(1) Mineral Reserves and Resources are reported in accordance with NI 43-101. |
(2) All figures have been rounded to reflect the relative accuracy of the estimates and totals may not add due to rounding. |
The major addition to the Yaramoko Mineral Reserve and Mineral Resource Estimate is delineation of Mineral Reserves and Mineral Resources near to surface and proximal to zones mined from underground in the early years of Yaramoko operations. Based on the 3,700m reverse circulation and diamond drilling program completed in February 2020 and subsequent completion of an internal mine plan analysis, these near-surface Mineral Reserves and Mineral Resources support the commencement of an open pit at the eventual completion of the 55 Zone underground mine (Figure 2). The potential 55 Zone open pit would be focussed on extracting the high grade near-surface material that forms the crown pillar, remnant halo mineralisation around the existing mine workings, and sub-parallel structures to the main 55 Zone structure that did not form part of the Z55 underground mining plans (Figure 3).
Figure 2. 55 Zone Mineral Resource Long-section (View Looking North)
Figure 3. 55 Zone Cross-section Showing the Open Pit and Mineralised Structures (View Looking East)1
Underground Drill Campaign
Underground drilling from the 4754 Level started in late September, ramping up to three diamond drill rigs by late October. This 14,500m program is designed to upgrade much of the Inferred Mineral Resource mineralization at depth (Figure 4) to an Indicated Mineral Resource confidence level, while also testing the opportunities for additional mineralization along strike. Detailed structural mapping and geostatistical work carried out on the 55 Zone over the last 12 months has further refined and enhanced the understanding of key mineralized structures within the high grade 55 Zone at depth, and is expected to result in a high degree of conversion and potential extension of intervals such as the 20.1g/t gold over 23.8m intersected in YRM-16-DD-426 (refer to Company press release November 29, 2016).
This drilling program is scheduled to be completed in early Q1 2021, with the results being incorporated into an updated Mineral Resource and Reserve Statement for the Yaramoko Gold Mine, planned for Q3 2021.
The planned underground drilling in 2022 from the 4300 Level will be focused on extending the current ore body beyond its existing Mineral Resource envelope, testing for additional depth extensions to approximately the 3800 Level, as well as testing the potential for additional mineralization along strike and from offset splay structures.
Figure 4. 55 Zone Long-section showing the planned infill drilling program.
Yaramoko Exploration Outlook
Over the course of this year, a review of near-surface mineralization opportunities across the Yaramoko property has been completed, incorporating a site-wide structural and geochemical review as well as integrating details and key observations from detailed mapping of the 55 Zone and Bagassi South underground workings. The program identified several early stage opportunities for additional exploration drilling in addition to the work carried out on the 55 Zone Open Pit.
High priority targets include several along the interpreted western corridor of the 55 Zone and at the Bagassi South (e.g. QV2 and QV3), 109 and 300 Prospects. Delineation of near surface oxide targets will be the initial focus of exploration activities at the Bagassi South, 109 and 300 Prospects. Additionally, exploration will be continuing to systematically test the remaining 23 high-priority targets (Figure 5), as well as further exploration work to identify and delineate additional targets within the permit boundaries.
Figure 5. Yaramoko Mine Complex and Prospects
Mineral Reserve Estimation Assumptions
Technical work for the construction of the 55 Zone and Bagassi South underground Mineral Reserves, including cut-off grade calculations, cost modelling, economic analysis, mine design, and scheduling was conducted, and/or supervised by Mr. Ashraf Suryaningrat, Senior Mining Engineer for Roxgold, and reviewed by Mr. Paul Criddle, COO for Roxgold.
Technical work for the construction of the 55 Zone open pit Mineral Reserves, including pit optimisation, cost modelling, economic analysis, mine design, and scheduling was conducted by Entech Mining Consultants, supervised by Mr. Ashraf Suryaningrat and reviewed by Mr. Paul Criddle, COO for Roxgold.
55 Zone and Bagassi South Underground Mineral Reserves Estimation
55 Zone and Bagassi South underground mines stope optimisation and design work was carried out by Mr. Ashraf Suryaningrat of Roxgold and generated in Deswik software.
Parameters used to complete optimisation, design and scheduling of the Mineral Reserves include:
- Gold Price of US$1,500/oz
- Processing recovery of 98.0%
- Payable gold of 99.2%
- Selling cost of US$5.50/oz
- Royalties (inclusive of Mining and Community Development Levy) of 6.0%
- 55 Zone mining cost of US$95.7/t, processing cost of US$25.0/t and G&A cost of US$16.9/t
- Bagassi South mining cost of US$95.1/t, processing cost of US$17.9/t and G&A cost of US$12.1/t
- Cut-off grades of 3.1g/t Au and 2.8g/t Au for 55 Zone and Bagassi South respectively
- Stope minimum mining width of 1.5m with final diluted stope shape widths of 2.2m and 2.4m for 55 Zone and Bagassi South respectively
- Mining recovery of 95.0% for stopes and 100.0% for sill drifts
The mining method for the 55 Zone and Bagassi South underground mines remains unchanged, utilising longhole retreat open stoping with articulated trucks for haulage to either the ore or waste pad locations. Mining services for the underground workings are completed by an underground mining contractor under the supervision of Roxgold.
55 Zone Open pit Mineral Reserves Estimation
55 Zone open pit optimisation and mine design work have been carried out by Entech Mining Consultants generated in Datamine software. Parameters used to complete the 55 Zone Open Pit Mineral Reserve estimate include the following:
- 0.9g/t Au cut-off grade
- Gold Price of US$1,500/oz
- Mining recovery of 85.0%
- Processing recovery of 98.0%
- Mining Dilution of 10%
- Overall slope angle ranging from 43° to 53°north to south
- Mining costs of US$3.26 per tonne
- Total processing costs of US$22.85 per tonne
- Total G&A cost of US$14.50 per tonne
- Selling cost of US$5.50/oz
- Royalties (Mining and Community Development Levy) of 6.0%
Entech Mining Consultants completed a multi-staged pit design analysis. The mining method for the 55 Zone open pit is planned to be a conventional truck and shovel method, common for open pit mines. Mining services of the open pit is planned to be completed by a mining contractor under the supervision of Roxgold. The costs used in the study were derived from a competitive tender with contactors active in Burkina Faso.
Mineral Resource Modeling and Estimation Assumptions
The Mineral Resources reported herein have been estimated using a geostatistical block modelling approach informed from gold assay data collected from drill hole and production samples. Technical work for the construction of the Yaramoko Mineral Resource, including wireframing, statistical and geostatistical analysis, and Mineral Resource estimation was conducted, and/or supervised by Mr. Hans Andersen of Roxgold and reviewed by Mr. Paul Weedon, VP of Exploration for Roxgold.
The Mineral Resource estimate incorporates all data from both production and drilling (RC and DD) activities to date, comprising of 1,419 drill holes and 6,012 production holes targeting the 55 Zone and Bagassi South deposits.
The 55 Zone Underground and Bagassi South Mineral Resource models were modelled and estimated using Leapfrog Geo and Edge software. The 55 Zone Open pit Mineral Resource model was developed and estimated using Datamine software. All gold assays from development channels and drill holes were composited to 1.0-meter intervals within the mineralised wireframes. Grade capping utilised the high yield approach for the 55 Zone Underground and Bagassi South estimates. The high yield thresholds were restricted to nominal 15m distances, based on production knowledge, while the 55 Zone Open pit Mineral Resource estimate used a traditional top-cut approach. Top-cuts were applied to individual domains based on the analysis of gold grade outliers within the statistical data populations and ranged between 0.8 g/t for the low-grade (e.g. shear envelope) domains to 500 g/t Au for the high-grade domains in active and mined production areas.
The Mineral Resource model gold grades were estimated using a combination of Ordinary Kriging and Inverse Distance methods using a multiple pass approach to inform the resource model. The grade estimates are validated visually by sectional comparison and through statistical approaches that encompass traditional validation methods, such as Swath plots comparing composite and block model values for each deposit. Geostatistical exploratory data analysis (“EDA”), variogram modelling and Mineral Resource model validation was conducted using Leapfrog Geo and Snowden Supervisor software.
Density values were assigned to the Mineral Resource models based on ascribed oxidisation state and lithological unit, with mineralisation being assigned the density of its predominant host. A density of 1.8 t/m3 was assigned to transported and alluvial sediments, with a range of 1.8 to 2.2 t/m3 assigned to the oxidised weathered profile and a range of 2.60 to 2.92 t/m3 assigned to fresh rock lithologies.
Mineral Resource models and drill hole data at the Yaramoko Gold Mine utilise the Adindan UTM grid (Zone 30) coordinate system with elevation heights converted to a local mine grid by the addition of +5,000 to the natural surface elevation.
The Mineral Resource models are classified into Measured, Indicated and Inferred categories based on analysis of the following criteria; number of samples informing the estimate, sample spacing, average sample distance, kriging efficiency and slope of regression outputs, drill hole and sample QAQC thresholds and geological confidence in modelled interpretations, grade continuity and level of geological understanding at each deposit.
The Mineral Resource models are depleted for all surveyed mining voids (including artisanal workings) as of June 30, 2020. The reported Mineral Resource includes all closing stockpile balances as of June 30, 2020.
The Yaramoko Open Pit Mineral Resource is reported constrained by a pit optimisation generated in Datamine software to satisfy the definition of Mineral Resources having reasonable prospects for eventual economic extraction, and is based on the following parameters:
- Gold price of US$1,700/oz
- Mining recovery of 85.0%
- Processing recovery of 98.0%
- Mining Dilution of 10%
- Overall slope angle ranging from 43° to 53° north to south
- Mining costs of US$3.26 per tonne
- Total processing costs of US$22.85 per tonne
- Total G&A cost of US$14.50 per tonne
- Selling cost of US$5.50/oz
- Royalties (inclusive of Mining and Community Development Levy) of 6.0%
Upcoming Catalysts
Event |
Timing |
||||
Ongoing infill, expansion and satellite target drilling program at Séguéla |
Q4 2020 |
||||
Drilling results from Boussoura |
Q4 2020 |
||||
Underground drilling program in 55 Zone at Yaramoko Mine Complex |
H1 2021 |
||||
Feasibility Study for Séguéla |
H1 2021 |
||||
Séguéla construction decision |
H1 2021 |
||||
Annual Mineral Resource & Reserve Update at Yaramoko Mine Complex (incorporating current underground drill campaign) |
H2 2021 |
Qualified Persons
Paul Criddle, FAusIMM, Chief Operating Officer for Roxgold, a Qualified Person within the meaning of NI 43-101, has reviewed, verified and approved the scientific and technical disclosure contained in this news release.
Paul Weedon, MAIG (#6001), Vice-President, Exploration for Roxgold Inc., a Qualified Person within the meaning of National Instrument 43-101, has reviewed, verified, and approved the scientific and technical disclosure contained in this news release. This includes the QA/QC, sampling, analytical and test data underlying this information. No limits were imposed on Mr. Weedon’s verification process.
The scientific and technical information contained in this document relating to the Yaramoko Mineral Resource is based on, and fairly represents, information compiled by Mr. Hans Andersen. Mr. Hans Andersen, MAIG (#5746), is a Member of the Australian Institute of Geoscientists. Mr. Andersen is a full-time employee of Roxgold Inc. and is not “independent” within the meaning of NI 43-101 Standards of Disclosure for Mineral Projects. Mr. Andersen has sufficient experience which is relevant to the style of mineralisation and type of deposit under consideration and to the activity which he is undertaking to qualify as a “Qualified Person” under NI 43-101. Mr. Andersen has consented to and approved the inclusion in this document of the matters based on his compiled information in the form and context in which it appears in this document.
Roxgold’s disclosure of Mineral Reserve and Mineral Resource information is governed by NI 43-101 and under the guidelines set out in the Canadian Institute of Mining, Metallurgy and Petroleum (“CIM”) Standards on Mineral Resources and Mineral Reserves, adopted by the CIM Council, as may be amended from time to time by the CIM. There can be no assurance that those portions of Mineral Resources that are not Mineral Reserves will ultimately be converted into Mineral Reserves.
For more information on the projects you can also refer to the Company’s technical reports entitled “Technical Report for the Yaramoko Gold Mine, Burkina Faso” dated December 20, 2017 and “NI 43-101 Technical Report, Séguéla Project, Preliminary Economic Assessment, Worodougou Region, Cote d’Ivoire” dated April 14, 2020, each available on the Company’s website at www.roxgold.com and SEDAR at www.sedar.com
Quality Assurance/Quality Control
All drilling data completed by Roxgold utilized the following procedures and methodologies. All drilling was carried out under the supervision of Roxgold personnel.
RC drilling used a 5.25-inch face sampling pneumatic hammer with samples collected into 60 litre plastic bags. Samples were kept dry by maintaining enough air pressure to exclude groundwater inflow. If water ingress exceeded the air pressure, RC drilling was stopped, and drilling converted to diamond core tails. Once collected, RC samples were riffle split through a three-tier splitter to yield a 12.5% representative sample for submission to the analytical laboratory. The residual 87.5% sample were stored at the drill site until assay results were received and validated. Coarse reject samples for all mineralized samples corresponding to significant intervals are retained and stored on-site at the Company controlled core yard.
Diamond drill holes were drilled with HQ or NQ2 sized diamond drill bits. The core was logged, marked up for sampling using standard lengths of one metre. Samples were then cut into equal halves using a diamond saw. One half of the core was left in the original core box and stored in a secure location at the Company core yard at Yaramoko. The other half was sampled, catalogued and placed into sealed bags and securely stored at the site until shipment.
All RC and diamond samples were shipped to ALS Laboratories laboratory in Ouagadougou for preparation. ALS Laboratories is independent of Roxgold. Samples were dried and crushed by the laboratory and a 250-gram split prepared from the coarse crushed material, prior to pulverization and preparation of a 200g sample with routine gold analysis using a 50-gram charge and fire assay with an atomic absorption finish. Quality control procedures included the systematic insertion of blanks, duplicates and sample standards into the sample stream. In addition, the laboratory inserted its own quality control samples.
Channel sampling of core drives is performed by Roxgold personnel on each core development face, with face advance usually 3m. Faces are sampled after inspection by geological staff, delineating the structure based on veins, lithology and alteration. A channel 40cm wide (20cm above and 20cm below the sample line) is marked out, centred on a sample line 1.5m from the drive floor, and represents the channel that samples are collected from. Sampling is carried out from the hangingwall to the footwall. Samples are bagged in uniquely numbered cotton bags and sent for analysis at the onsite SGS Laboratory. Sample widths vary according to geological structure with the minimum width of 0.3m to a maximum width of 1.0m. Each sample weighs approximately 2.0kg. QA/QC samples are inserted within every eleventh sample, particularly if visible gold is observed.
For more information on the Company’s QA/QC and sampling procedures, please refer to the Company’s Annual Information Form for the year ended December 31, 2019, available on the Company’s website at www.roxgold.com and on SEDAR at www.sedar.com.
About Roxgold
Roxgold is a Canadian-based gold mining company with assets located in West Africa. The Company owns and operates the high-grade Yaramoko Mine Complex located on the Houndé greenstone belt in Burkina Faso and is advancing the development and exploration of the Séguéla Gold Project located in Côte d’Ivoire. Roxgold trades on the TSX under the symbol ROXG and as ROGFF on OTCQX.
This news release contains “forward-looking information” within the meaning of applicable Canadian securities laws (“forward-looking statements”). Such forward-looking statements include, without limitation: statements with respect to Mineral Reserves and Mineral Resource estimates (including proposals for the potential growth, extension, update and/or upgrade thereof, the anticipated timing thereof and any future economic benefits which may be derived therefrom), the timing and delivery of any future updated resource models, the Feasibility Study and other economic studies, and the expected timing thereof (including with respect to the delivery of ore and future stoping and other mining operations), proposed exploration plans and the timing and costs thereof, and sufficiency of future funding. These statements are based on information currently available to the Company and the Company provides no assurance that actual results will meet management's expectations. In certain cases, forward-looking information may be identified by such terms as "anticipates", "believes", "could", "estimates", "expects", "may", "shall", "will", or "would". Forward-looking information contained in this news release is based on certain factors and assumptions regarding, among other things, the estimation of Mineral Resources and Mineral Reserves, the realization of resource estimates and reserve estimates, gold metal prices, the timing and amount of future exploration and development expenditures, the estimation of initial and sustaining capital requirements, the estimation of labour and operating costs, the availability of necessary financing and materials to continue to explore and develop the Yaramoko Gold Mine and Séguéla Gold Project in the short and long-term, the progress of exploration and development activities as currently proposed and anticipated, the receipt of necessary regulatory approvals and permits, and assumptions with respect to currency fluctuations, environmental risks, title disputes or claims, and other similar matters, as well as assumptions set forth in the Company’s technical reports entitled “Technical Report for the Yaramoko Gold Mine, Burkina Faso” dated December 20, 2017 and “NI 43-101 Technical Report, Séguéla Project, Preliminary Economic Assessment, Worodougou Region, Cote d’Ivoire” dated April 14, 2020, each available on the Company’s website at www.roxgold.com and SEDAR at www.sedar.com. While the Company considers these assumptions to be reasonable based on information currently available to it, they may prove to be incorrect.
Although the Company believes the expectations expressed in such forward-looking statements are based on reasonable assumptions, such statements are not guarantees of future performance and actual results or developments may differ materially from those in the forward-looking statements. Factors that could cause actual results to differ materially from those in forward-looking statements include: changes in market conditions, unsuccessful exploration results, possibility of project cost overruns or unanticipated costs and expenses, changes in the costs and timing of the development of new deposits, inaccurate reserve and resource estimates, changes in the price of gold, unanticipated changes in key management personnel, failure to obtain permits as anticipated or at all, failure of exploration and/or development activities to progress as currently anticipated or at all, and general economic conditions. Also, please refer to the risk factors contained in the Company’s Annual Information Form for the year ended December 31, 2019 available on the Company’s website at www.roxgold.com and SEDAR at www.sedar.com. Mining exploration and development is an inherently risky business. Accordingly, actual events may differ materially from those projected in the forward-looking statements. This list is not exhaustive of the factors that may affect any of the Company's forward-looking statements. These and other factors should be considered carefully and readers should not place undue reliance on the Company's forward-looking statements. The Company does not undertake to update any forward-looking statement that may be made from time to time by the Company or on its behalf, except in accordance with applicable securities laws.
1 Refer to Company press releases dated as follows for drill assay results: October 25, 2012; May 19, 2015; October 8, 2015; August 31, 2016; September 30, 2020 |
View source version on businesswire.com: https://www.businesswire.com/news/home/20201110005408/en/

