


The Base Metal Breakout – Industrial Commodities Threaten Their Decade-Long Downtrend
Summary:
- Base metals are showing signs of real strength, with prices across the complex breaking out, or threatening to do so.
- Copper and zinc have looked the strongest of the bunch and both have recently broke out of multi-month consolidation patterns.
- The moves we are seeing have the hallmarks of a supply (destruction) driven rally, which tend to be sharp and ferocious in nature.
- An industry-wide decline in reserve quantity (depletion) and quality (grade), accompanied with a complete lack of new discoveries means we believe we're likely to see an increase in M&A as prices begin to rise, which is why we're interested in quality exploration and development stage plays.
Every now and then you get a feeling that the market is sending a message. Last week was one of those weeks as we witnessed a whole host of commodities either breaking out of multi-month consolidation patterns, or seriously threatening to do so.
The topside moves were generally spread across the commodity complex, but by far the most significant moves were seen in the base metals where we witnessed breakouts across the board, some in rather spectacular fashion.
From a higher level, this is best shown in a chart of the Bloomberg Industrial Metal Index, which has now broken out above a down trend that has been in place since the index peaked way back in 2007, over a decade ago.

Figure 1: Monthly candlestick chart of the Bloomberg Industrial Metals Index as of Friday, 18th of August, 2017.Source: Investing.com
When we dive into the individual metals, the recent top performers have undeniably been zinc (+ lead) and copper, both breaking out of multi-month consolidation patterns over the last few weeks to new multi-year highs.
This is not surprising to us given the strong fundamental drivers we see impacting the industry (largely supply side) and the moves we are seeing have all the hallmarks of one of Rick Rule's favorite sayings playing out in reality - "Bear markets are always the authors of bull markets".
That is because we are finally seeing signs of real supply destruction as a result of the brutal five to ten year bear market we've experienced in the commodity complex. Crucially for investors, it appears as though this is also starting to have an impact on commodity prices.
So, let's take a closer look at two of the more dramatic movers - zinc and copper.
Zinc:
Zinc in particular has looked extremely strong and you can clearly see the week's breakout on the chart below. The metal most commonly used as a galvanizing agent now appears to have successfully consolidated its 2016 run, which saw it claim the status of the best performing metal last year (with the exception of iron ore).
As of its close on Friday, the zinc price is up 115% from its January 2016 low of $1,440/t.
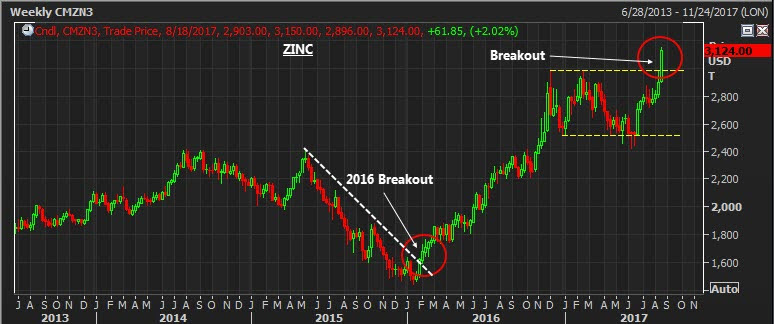
Figure 2: Weekly zinc price candlestick chart, as of Friday, 18th of August, 2017. Source: Thomson Eikon
Zinc's run has all the hallmarks of a supply (or lack thereof) driven move, which tend to be swift and devoid of major pullbacks or periods of choppiness.
This is supported by the hard data, which shows that since 2012, we've seen over 1 million tonnes (Mt) of shuttered production in a 13Mt market*1. Glencore alone (the world's largest zinc producer) cut its zinc production by 24% in 2016, a year which also saw the closing of two of the world’s major zinc mines in Century (Australia) and Lisheen (Ireland).
We have been hearing of potential tightness in the zinc market for a while now, only to see "hidden" supply (likely of Chinese origin) dumped on the market whenever prices rallied.
However, this dynamic seems to have completely changed and Chinese figures now show the country is dealing with a significant mined deficit caused by declining production from the countries domestic mines.
Last week’s news that the Chinese government ordered a shutdown of all the lead and zinc mines in the Hunan province's Huayuan county (a major zinc producing region) suggests that the countries zinc deficit is only likely to grow in the near to mid-term, further adding to the already strong tailwinds currently affecting the zinc price.
Copper:
Whilst not quite as spectacular as zinc, copper has shown signs of a real resurgence in 2017. The move started late in 2016 after the copper price ground out a text book basing pattern throughout the first three quarters of the year before breaking out proper in November.
2017 saw those gains consolidated as price traded in a sideways range before leading the base metals complex in breaking out topside a few weeks ago back in late July. Price is currently testing the key $3/lb level, as shown in the chart below.
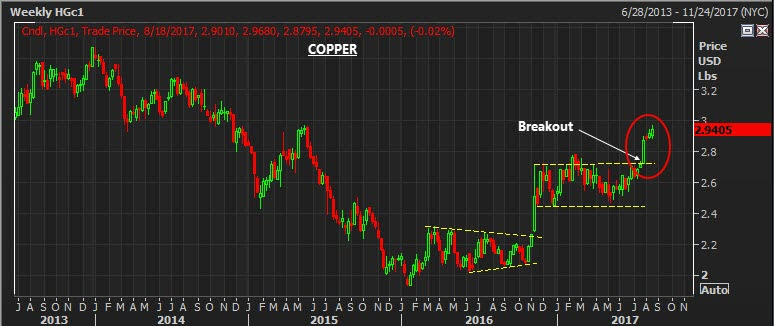
Figure 3: Weekly copper price candlestick chart, as of Friday, 18th of August, 2017. Source: Thomson Eikon
As with most commodities we follow, we believe the most reliable drivers of the copper price into the foreseeable future are going to come primarily from the supply side of the equation. This is because we know that the industry is mining well above its reserve grade, meaning that over time the industry average mined grade is almost certain to decline.
Lower mined grades mean miners will have to increase the volume of ore they process every year, just to "tread water". It also means we're likely to see a climbing industry wide average cost of production (less copper produced per ton of ore mined/processed), increasingly rendering mines at the higher end of the cost curve uneconomic unless the copper price rises enough to compensate for the declining grades.
A text book example of this phenomenon can be seen at the Escondida mine in Chile, currently the largest copper mine in the world, producing over 5% of global annual supply.
The Escondida mine is currently mining ore that grades around 1% Cu, which is 1.4 x the life-of-mine reserve grade of its sulfide ore body, which currently sits just under 0.6% Cu. In other words, the mine is being "high graded", meaning simple mathematics dictates that mine grades are set to steadily decline into the future.
This phenomenon is clearly visible in BHP's (57.5% owner) 2016 operational update which highlighted a huge 28% year-on-year decline in mined grade during the year. Whilst part of the decline was due to grade variability within the ore body, it highlights a trend of a declining grade profile that's only going to worsen over time.
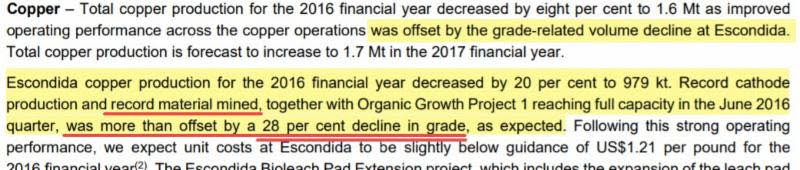
Figure 4: Excerpt from BHP's June 2016 year end operational review. Source: BHP's June 2016 news release, page 6.
This problem is by no means limited to Escondida, but rather is pervasive across the entire copper sector. With the world’s copper mines not only rapidly depleting in absolute terms (depletion), but also falling in quality by way of grade decline (result of high grading), we believe we're likely to see significant downward pressure on the amount of the copper the industry is able to produce.
Completely ignoring the demand side of the equation (which is harder to quantify, but we are generally bullish on - think the increasing push towards electrification), an industry wide flat to declining production profile is usually a key ingredient in the recipe for higher prices.
To compound matters, low copper prices have all but killed the copper exploration sector, both at a brown fields (near existing mines) and green fields (new discoveries) level. The result, with a couple of notable exceptions, is that there is almost nothing in the way of new world-class copper projects ready to replace depletion from existing stock of copper mines.
This is why we are paying particular attention to exciting exploration projects, new copper discoveries and the few existing high-quality development plays which we believe are becoming increasingly attractive acquisition targets as the copper market turns and producer are forced to look at options to replace their rapidly depleting reserves.
Elsewhere in the base metals complex - nickel and cobalt look interesting
I wanted the focus of this article to be on zinc and copper, however it's important to note there have been equally as important moves elsewhere in the sector, particularly in the metals that are leveraged to the rapidly growing lithium ion (Li-ion) battery sector like nickel and cobalt.
Nickel:
For example nickel, has been slowly but surely attempting to grind out a base over the past 18 months. This is shown on the chart below with the June/July low potentially forming the first major "lower high" since way back in 2011.
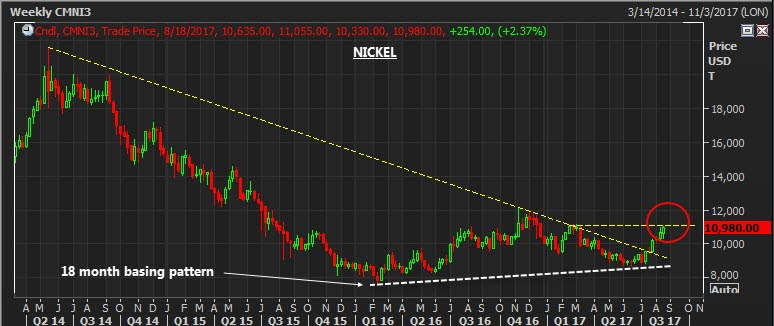
Figure 5: Weekly nickel price candlestick chart, as of Friday, 18th of August, 2017. Source: Thomson Eikon
Nickel prices peaked at almost $54,000/t back in 2007. This means that at the current price of just under $11,000/t, the key ingredient in stainless steel is still down almost 80% from its peak seen over a decade ago, making it probably the single most contrarian metal within the base metals complex.
Nickel prices have shown a recent bout of strength, moving higher over the past few months and are now threatening to break out above the 2016 highs of $12,000/t - a key level to watch.
At face value, the fundamentals driving the sector look less favorable than the likes of zinc or copper (near record high warehouse inventory levels being key). However, there are enough green shoots out there to suggest it's a metal that's at least worthy of adding to your watch list.
One of the key drivers to watch is the growth of the electric vehicle and Li-ion battery industry, where nickel is a key (and becoming increasingly important) ingredient in most battery chemistries.
It's difficult to predict the growth of the Li-ion sector (an industry prone to hyperbole), however the demand it is generating looks to be already having an impact, with nickel inventories declining for the first time in half a decade in 2015/16 in a world of flat to slightly increasing global mine production.
Whilst it's far from a perfect indicator, I am also keeping a close eye on warehouse inventory levels as I believe an increase in the rate-of-decline will be a key "tell-tale" that the supply/demand balance is moving in favor of higher prices.
Should we see the continued strong growth in Li-ion uptake as the world moves towards electric vehicles, I believe there is potential for the nickel price to surprise a lot of people to the upside over the coming years.
Cobalt:
I've touched on cobalt a lot this year because it's a metal with a very unique set of factors that affect its supply/demand balance, the key ones being:
* A tiny market size meaning it is prone to demand induced price shocks
* Supply that is dominated by production from one of the worlds least geopolitically unstable countries, the Democratic Republic of Congo (DRC)
* Demand that appears to be soaring thanks to cobalt being arguably the key input in most of the Li-ion battery chemistries that electric vehicles industry is moving towards.
Without going into the details (you can read my original write up from back in February here), the cobalt story is playing out largely as I expected with cobalt prices up over 140% from the 2016 lows.
The cobalt price has been consolidating in a relatively narrow range over the past 4 months, forming a bullish ascending triangle, a continuation pattern that often forms during strong up-trends.
Price is now threatening to breakout topside, as shown in the chart below by the weekly close at the high of its trading range.
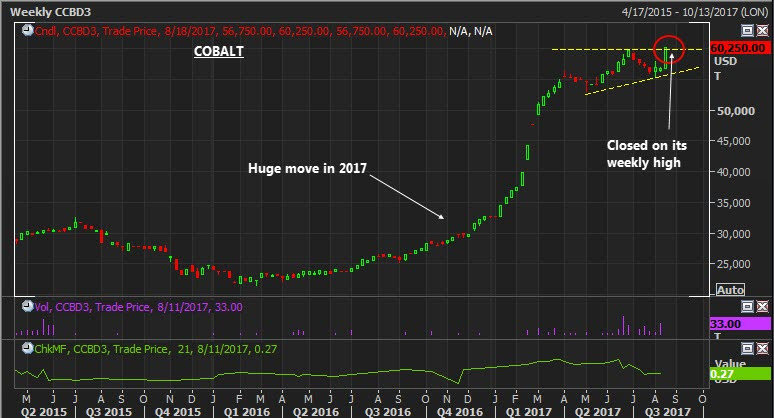
Figure 6: Weekly cobalt price candlestick chart, as of Friday, 18th of August, 2017. Source: Thomson Eikon
Whilst technical patterns are never a guarantee of higher prices, a topside break over the coming few weeks would indicate continued buying pressure and would suggest the balance of probabilities has moved in favor of further price increases.
Lastly, we are moving towards the time of the year where the DRC political issues are likely to come to a head as the current president, Joseph Kabila, has promised that he will hold democratic elections by the end of 2017, something that now looks to be an almost impossibility.
Given the country is responsible for 60% to 65% of global mine production, there's the potential for us to see a serious impact to global supply should we see material unrest in the country.
In other words, if you're invested in the cobalt space, keep a very close eye on the DRC over the next four months.
Concluding comments:
Just as night becomes day, bear markets are always authors of an ensuing bull market and it appears as though this process is finally playing out in the base metals sector. This is seen by the stagnant-to-decreasing supply environment now present across many of the world’s key industrial metals.
This has started to cause sharp moves in metals such as zinc and copper, price action that is typically associated with rallies driven primarily by constrained supply.
Whilst there is no guarantee that this breakout will continue, after almost a decade of declines the recent strong price action suggests it's time to (at the very least) pay close attention to the complex.
We favor companies at the exploration to development stage of the spectrum given we see reserve replacement being arguably the key issue for the sector moving forward.
However, given the prolonged bear market we've experienced, we see opportunities across the spectrum of explorers through to major miners.
If you have any questions or comments regarding this article, please reply to this email or contact your Sprott representative at 800-477-7853.
*1 Comparing 2012 to 2016 figures, USGS Annual Zinc Market Statistics.
Sprott U.S. Media, Inc. is a wholly owned subsidiary of Sprott Inc., which is a public company listed on the Toronto Stock Exchange and operates through its wholly-owned direct and indirect subsidiaries: Sprott Asset Management LP, an adviser registered with the Ontario Securities Commission; Sprott Private Wealth LP, an investment dealer and member of the Investment Industry Regulatory Organization of Canada; Sprott Global Resource Investments Ltd., a US full service broker-dealer and member FINRA/SIPC; Sprott Asset Management USA Inc., an SEC Registered Investment Advisor; and Resource Capital Investment Corp., also an SEC Registered Investment Advisor. We refer to the above entities collectively as “Sprott”. The information contained herein does not constitute an offer or solicitation by anyone in any jurisdiction in which such an offer or solicitation is not authorized or to any person to whom it is unlawful to make such an offer or solicitation. Forward-Looking Statement This report contains forward-looking statements which reflect the current expectations of management regarding future growth, results of operations, performance and business prospects and opportunities. Wherever possible, words such as “may”, “would”, “could”, “will”, “anticipate”, “believe”, “plan”, “expect”, “intend”, “estimate”, and similar expressions have been used to identify these forward-looking statements. These statements reflect management’s current beliefs with respect to future events and are based on information currently available to management. Forward-looking statements involve significant known and unknown risks, uncertainties and assumptions. Many factors could cause actual results, performance or achievements to be materially different from any future results, performance or achievements that may be expressed or implied by such forward-looking statements. Should one or more of these risks or uncertainties materialize, or should assumptions underlying the forward-looking statements prove incorrect, actual results, performance or achievements could vary materially from those expressed or implied by the forward-looking statements contained in this document. These factors should be considered carefully and undue reliance should not be placed on these forward-looking statements. Although the forward-looking statements contained in this document are based upon what management currently believes to be reasonable assumptions, there is no assurance that actual results, performance or achievements will be consistent with these forward-looking statements. These forward-looking statements are made as of the date of this presentation and Sprott does not assume any obligation to update or revise. Views expressed regarding a particular company, security, industry or market sector should not be considered an indication of trading intent of any fund or account managed by Sprott. Any reference to a particular company is for illustrative purposes only and should not to be considered as investment advice or a recommendation to buy or sell nor should it be considered as an indication of how the portfolio of any fund or account managed by Sprott will be invested.
