Company reports increased quarterly production and lower costs
Returned capital of approximately $300 million year-to-date
TORONTO, Nov. 09, 2022 (GLOBE NEWSWIRE) -- Kinross Gold Corporation (TSX: K, NYSE: KGC) (“Kinross” or the “Company”) today announced its results for the third-quarter ended September 30, 2022.
This news release contains forward-looking information about expected future events and financial and operating performance of the Company. Please refer to the risks and assumptions set out in our Cautionary Statement on Forward-Looking Information located on page 30 of this release. All dollar amounts are expressed in U.S. dollars, unless otherwise noted.
Results from the Company’s Russian and Ghanaian assets have been excluded from its Q3 2022 continuing results, along with comparative figures, due to the classification of these assets as discontinued as at September 30, 2022.
Q3 2022 highlights from continuing operations:
- Gold equivalent production of 529,155 Au eq. oz. produced, an increase of 17% compared with Q2.
- Production cost of sales1 of $941 per Au eq. oz. sold and all-in sustaining cost2 of $1,282 per Au eq. oz. sold, representing reductions of 8% and 4%, respectively, compared with Q2.
- Margins3 of $791 per Au eq. oz. sold.
- Operating cash flow4 of $173.2 million and adjusted operating cash flow2 of $259.4 million.
- Reported net earnings5 of $65.9 million, or $0.05 per share, with adjusted net earnings2, 6 of $68.7 million, or $0.05 per share2.
- Cash and cash equivalents of $488.4 million, and total liquidity7 of approximately $2 billion at September 30, 2022.
Return of capital:
- Kinross returned approximately $300 million of capital to its shareholders year-to-date through its enhanced share buyback and quarterly dividend programs, or approximately $0.23 per share. Full year return of capital is expected to be approximately $450 million.
- Since launching an enhanced share buyback program in September, the Company has re-purchased approximately $180 million in shares, or 60%, out of the $300 million planned for 2022.
- Kinross’ Board of Directors declared a quarterly dividend of $0.03 per common share payable on December 15, 2022 to shareholders of record at the close of business on December 1, 2022.
________________________
1 “Production cost of sales from continuing operations per equivalent ounce sold” is defined as production cost of sales, as reported on the interim condensed consolidated statements of operations, divided by total gold equivalent ounces sold from continuing operations.
2 These figures are non-GAAP financial measures and ratios, as applicable, and are defined and reconciled on pages 18 to 23 of this news release. Non-GAAP financial measures and ratios have no standardized meaning under IFRS and therefore, may not be comparable to similar measures presented by other issuers.
3 “Margins” from continuing operations per equivalent ounce sold is defined as average realized gold price per ounce from continuing operations less production cost of sales from continuing operations per equivalent ounce sold.
4 Operating cash flow figures in this release represent “Net cash flow of continuing operations provided from operating activities,” as reported on the interim condensed consolidated statements of cash flows.
5 Reported net earnings (loss) figures in this news release represent “Net earnings (loss) from continuing operations attributable to common shareholders,” as reported on the interim condensed consolidated statements of operations.
6 Adjusted net earnings figures in this news release represent “Adjusted net earnings from continuing operations attributable to common shareholders.”
7 “Total liquidity” is defined as the sum of cash and cash equivalents, as reported on the interim condensed consolidated balance sheets, and available credit under the Company’s credit facilities (as calculated in Section 6 – Liquidity and Capital Resources of Kinross’ MD&A for the three and nine months ended September 30, 2022).
Company guidance:
- Kinross is expecting its 2022 production to be approximately 2 million Au eq. oz., mainly due to the temporary delays in La Coipa’s mill ramp-up and commissioning related to the Tasiast 21k project. Full-year production from continuing operations for the year ended December 31, 2021 was 1,447,240 Au eq. oz.
- The Company expects its 2022 production cost of sales to be slightly above $900 per Au eq. oz. All-in sustaining cost is expected to be approximately $1,240 per Au eq. oz. sold2. Consolidated production cost of sales was $8328 per Au eq. oz. sold and attributable all-in sustaining cost of sales was $1,1382, 8 per Au eq. oz. sold for the year ended December 31, 2021.
- The Company now anticipates its 2022 capital expenditures to be approximately $750 million mainly due to deferred capital development across the portfolio. Capital expenditures from continuing operations were $822 million for the year ended December 31, 2021.
- Kinross has updated its forecast to produce approximately 2.1 million attributable9 Au eq. oz. in 2023 and 2024, respectively, and approximately 2 million attributable9 Au eq. oz. in 2025.
Development projects:
- The Great Bear project in Red Lake, Ontario, continues to make excellent progress and the Company plans to declare an initial mineral resource estimate in early 2023. Drilling results continue to confirm Kinross’ vision of developing a large, long-life mining complex.
- The Tasiast 24k project is on schedule to reach 24,000 tonnes per day throughput in mid-2023.
- The Manh Choh project advanced well during the quarter with production expected in the second half of 2024.
CEO Commentary:
J. Paul Rollinson, President and CEO, made the following comments in relation to 2022 third-quarter results:
“During the quarter, our operations increased production and lowered costs, primarily driven by higher grades at Paracatu, enhanced seasonal recoveries from our U.S.-based heap leaches, and the ramp-up at La Coipa, which progressed well and is expected to continue trending upwards with the mill averaging throughput levels of approximately 9,500 tonnes per day in October. Tasiast is on track to significantly increase production in the fourth quarter, with higher recoveries and increased throughput, which is expected to contribute to our strongest quarter of 2022.
“We are excited about our pipeline of development and exploration projects, which all made strong progress during the quarter. At the world-class Great Bear project, drilling results continue to fulfill our expectations, including high-grade intercepts at depth, and we are on track to declare an initial mineral resource early next year.
“We have returned approximately $300 million of capital to shareholders so far this year and expect to return a total of approximately $450 million by year-end through our share repurchase and dividend programs. Since launching our enhanced share buyback program in September, we have spent $180 million, effectively repurchasing for cancellation the shares that were issued as part of the Great Bear transaction while maintaining our quarterly dividend and investment-grade balance sheet.
“During the quarter we continued to advance our ESG goals. On climate change and emissions reductions, we have completed an analysis of climate-related scenarios and their potential impacts on our future business, advanced our pipeline of energy-efficiency projects, and entered into strategic partnerships with various technology providers, suppliers and electric utilities.”
________________________
8 Results as previously reported for the year ended December 31, 2021 include Ghanaian and Russian operations. Production cost of sales per equivalent ounce sold for the year ended December 31, 2021 is “Consolidated production cost of sales per equivalent ounce sold” and is defined as production cost of sales, as reported on the consolidated statements of operations for the year ended December 31, 2021, divided by total gold equivalent ounces sold. Attributable all-in sustaining cost per equivalent ounce sold of $1,138 for the year ended December 31, 2021 includes Kinross' share of Chirano (90%) production and costs. The definition and reconciliation of this non-GAAP ratio is included on page 20 of this news release.
9 Attributable production guidance includes Kinross' share of Manh Choh (70%) production.
Summary of financial and operating results
| Three months ended | Nine months ended | ||||||||||
| September 30, | September 30, | ||||||||||
| (unaudited, in millions of U.S. dollars, except ounces, per share amounts, and per ounce amounts) | 2022 | 2021 | 2022 | 2021 | |||||||
| Operating Highlights | |||||||||||
| Total gold equivalent ounces(a) | |||||||||||
| Produced(c) | 542,677 | 486,819 | 1,612,770 | 1,591,939 | |||||||
| Sold(c) | 509,431 | 481,959 | 1,517,337 | 1,586,028 | |||||||
| Total gold equivalent ounces from continuing operations(g) | |||||||||||
| Produced(c) | 529,155 | 328,409 | 1,361,554 | 1,106,903 | |||||||
| Sold(c) | 494,413 | 325,162 | 1,307,219 | 1,104,293 | |||||||
| Attributable gold equivalent ounces(a) | |||||||||||
| Produced(c) | 541,325 | 483,060 | 1,604,564 | 1,579,928 | |||||||
| Sold(c) | 507,930 | 478,459 | 1,508,555 | 1,574,362 | |||||||
| Financial Highlights from Continuing Operations(g) | |||||||||||
| Metal sales | $ | 856.5 | $ | 582.4 | $ | 2,378.9 | $ | 1,984.7 | |||
| Production cost of sales | $ | 465.3 | $ | 289.8 | $ | 1,279.2 | $ | 914.0 | |||
| Depreciation, depletion and amortization | $ | 185.1 | $ | 173.2 | $ | 532.1 | $ | 530.3 | |||
| Operating earnings (loss) | $ | 111.3 | $ | (23.7 | ) | $ | 277.8 | $ | 209.8 | ||
| Net earnings (loss) from continuing operations attributable to common shareholders | $ | 65.9 | $ | (72.9 | ) | $ | 137.9 | $ | 36.3 | ||
| Basic earnings (loss) per share from continuing operations attributable to common shareholders | $ | 0.05 | $ | (0.06 | ) | $ | 0.11 | $ | 0.03 | ||
| Diluted earnings (loss) per share from continuing operations attributable to common shareholders | $ | 0.05 | $ | (0.06 | ) | $ | 0.11 | $ | 0.03 | ||
| Adjusted net earnings from continuing operations attributable to common shareholders(b) | $ | 68.7 | $ | 11.2 | $ | 174.9 | $ | 183.4 | |||
| Adjusted net earnings from continuing operations per share(b) | $ | 0.05 | $ | 0.01 | $ | 0.14 | $ | 0.15 | |||
| Net cash flow of continuing operations provided from operating activities | $ | 173.2 | $ | 140.3 | $ | 528.2 | $ | 547.1 | |||
| Adjusted operating cash flow from continuing operations(b) | $ | 259.4 | $ | 141.3 | $ | 760.4 | $ | 671.7 | |||
| Capital expenditures from continuing operations(d) | $ | 197.3 | $ | 203.8 | $ | 447.4 | $ | 566.0 | |||
| Free cash flow from continuing operations(b) | $ | (24.1 | ) | $ | (63.5 | ) | $ | 80.8 | $ | (18.9 | ) |
| Average realized gold price per ounce from continuing operations(e) | $ | 1,732 | $ | 1,792 | $ | 1,821 | $ | 1,797 | |||
| Production cost of sales from continuing operations per equivalent ounce(c) sold(f) | $ | 941 | $ | 891 | $ | 979 | $ | 828 | |||
| Production cost of sales from continuing operations per ounce sold on a by-product basis(b) | $ | 919 | $ | 881 | $ | 966 | $ | 818 | |||
| All-in sustaining cost from continuing operations per ounce sold on a by-product basis(b) | $ | 1,269 | $ | 1,365 | $ | 1,279 | $ | 1,162 | |||
| All-in sustaining cost from continuing operations per equivalent ounce(c) sold(b) | $ | 1,282 | $ | 1,369 | $ | 1,287 | $ | 1,169 | |||
| Attributable all-in cost(h) from continuing operations per ounce sold on a by-product basis(b) | $ | 1,555 | $ | 1,766 | $ | 1,543 | $ | 1,552 | |||
| Attributable all-in cost(h) from continuing operations per equivalent ounce(c) sold(b) | $ | 1,560 | $ | 1,766 | $ | 1,547 | $ | 1,555 | |||
(a) Total gold equivalent ounces produced and sold and attributable gold equivalent ounces produced and sold include results from the Kupol, Dvoinoye and Chirano mines up to their disposal. "Total gold equivalent ounces" includes 100% of Chirano production. "Attributable gold equivalent ounces" includes Kinross' share of Chirano (90%) production.
(b) The definition and reconciliation of these non-GAAP financial measures and ratios is included in on pages 18 to 23 of this news release. Non-GAAP financial measures and ratios have no standardized meaning under IFRS and therefore, may not be comparable to similar measures presented by other issuers.
(c) “Gold equivalent ounces” include silver ounces produced and sold converted to a gold equivalent based on a ratio of the average spot market prices for the commodities for each period. The ratio for the third quarter of 2022 was 89.91:1 (third quarter of 2021 – 73.45:1). The ratio for the first nine months of 2022 was 83.22:1 (first nine months of 2021 – 69.90:1).
(d) “Capital expenditures from continuing operations” is as reported as “Additions to property, plant and equipment” on the interim condensed consolidated statements of cash flows.
(e) “Average realized gold price per ounce from continuing operations” is defined as gold metal sales from continuing operations divided by total gold ounces sold from continuing operations.
(f) “Production cost of sales from continuing operations per equivalent ounce sold” is defined as production cost of sales divided by total gold equivalent ounces sold from continuing operations.
(g) On June 15, 2022, the Company announced that it had completed the sale of its Russian operations, which includes the Kupol and Dvoinoye mines and the Udinsk project. On August 10, 2022, the Company announced that it had completed the sale of its Chirano mine in Ghana. Results for the three and nine months ended September 30, 2022 and 2021 are from continuing operations and exclude results from the Company’s Chirano and Russian operations due to the classification of these operations as discontinued as at September 30, 2022.
(h) “Attributable all-in cost” includes Kinross’ share of Manh Choh (70%) costs.
The following operating and financial results are based on third-quarter gold equivalent production and exclude Russian and Ghanaian operations except where noted:
Production: Kinross produced 529,155 Au eq. oz. in Q3 2022 from continuing operations, a 61% increase compared with 328,409 Au eq. oz. in Q3 2021. The year-over-year increase was primarily attributable to higher production at Tasiast due to the temporary suspension of milling operations as a result of the mill fire in June 2021, at Paracatu due to an increase in grade and recovery, and at La Coipa due to the restart and mill ramp-up.
Average realized gold price: The average realized gold price from continuing operations in Q3 2022 was $1,732 per ounce, compared with $1,792 per ounce in Q3 2021.
Revenue: During the third quarter, revenue from continuing operations increased to $856.5 million, compared with $582.4 million during Q3 2021.
Production cost of sales: Production cost of sales from continuing operations per Au eq. oz. sold increased to $941 for the quarter, compared with $891 in Q3 2021, mainly as a result of inflationary cost pressures on key consumables, such as fuel, emulsion and reagents across the portfolio.
Production cost of sales from continuing operations per Au oz. sold2 on a by-product basis was $919 in Q3 2022, compared with $881 in Q3 2021, based on gold sales of 480,775 ounces and silver sales of 1,226,108 ounces.
Margins3: Kinross’ margin from continuing operations per Au eq. oz. sold was $791 for Q3 2022, compared with the Q3 2021 margin of $901.
All-in sustaining cost2: All-in sustaining cost from continuing operations per Au eq. oz. sold was $1,282 in Q3 2022, compared with $1,369 in Q3 2021.
In Q3 2022, all-in sustaining cost from continuing operations per Au oz. sold on a by-product basis was $1,269, compared with $1,365 in Q3 2021.
Operating cash flow: Operating cash flow from continuing operations4 was $173.2 million for Q3 2022, compared with $140.3 million for Q3 2021.
Adjusted operating cash flow from continuing operations2 increased to $259.4 million in Q3 2022, compared with $141.3 million for Q3 2021.
Free cash flow2: Free cash flow from continuing operations in Q3 2022 was an outflow of $24.1 million, however included total working capital changes representing an outflow of $86.2 million10. In Q3 2021, free cash flow was an outflow of $63.5 million.
Earnings: Reported net earnings5 from continuing operations was $65.9 million, or $0.05 per share for Q3 2022, compared with reported net loss of $72.9 million, or $0.06 per share, for Q3 2021. The increase in reported net earnings was mainly due to the temporary suspension of milling operations at Tasiast in June 2021.
Adjusted net earnings from continuing operations2,6 were $68.7 million, or $0.05 per share, for Q3 2022, compared with $11.2 million, or $0.01 per share, for Q3 2021.
Capital expenditures: Capital expenditures from continuing operations decreased to $197.3 million for Q3 2022, compared with $203.8 million for Q3 2021. The decrease was primarily due to mine sequencing at Tasiast, Fort Knox and Round Mountain involving a decrease in capital stripping, partially offset by increased expenditures at La Coipa and an increase in capital stripping at Bald Mountain.
Balance sheet
As of September 30, 2022, Kinross had cash and cash equivalents of $488.4 million, compared with $719.1 million at June 30, 2022.
During the quarter, the Company made net repayments of $100 million on the outstanding balance on its revolving credit facility and maintained its investment grade balance sheet.
As of September 30, 2022, the Company had additional available credit11 of approximately $1.5 billion and total liquidity7 of approximately $2 billion.
________________________
10 Total working capital changes is defined as the sum of the changes in operating assets and liabilities, including income taxes paid, as reported on the interim condensed consolidated statements of cash flows (as shown in the adjusted operating cash flow from continuing operations reconciliation table on page 19 of this news release).
11 “Available credit” is defined as available credit under the Company’s credit facilities and is calculated in Section 6 – Liquidity and Capital Resources of Kinross’ MD&A for the three and nine months ended September 30, 2022.
Return of capital
On September 19, 2022, Kinross announced an enhanced share buyback program, allocating an increased portion of asset sales’ proceeds and excess free cash flow to share buybacks. The Company believes Kinross’ shares offer exceptional returns on invested capital, and that the buyback offers a highly attractive use of excess cash. The buyback program will also allow reinvestment in the business and the maintenance of a strong credit profile.
Reflecting the Company’s financial strength and proceeds from recent asset sales, under the enhanced share buyback program Kinross has re-purchased approximately $180 million in shares, or 60% of the $300 million target for 2022. Year-to-date Kinross has returned approximately $300 million of capital through its enhanced share buyback and quarterly dividend programs, and expects to return total capital of approximately $450 million by year end.
On September 29, 2022, Kinross received approval from the Toronto Stock Exchange to increase its normal course issuer bid (“NCIB”) program. Under the amended NCIB program, the Company is authorized to purchase up to 114,047,070 of its common shares (out of the 1,300,045,558 common shares outstanding as at July 27, 2022) representing 10% of the Company’s public float, during the period starting on August 3, 2022 and ending on August 2, 2023.
As part of its continuing quarterly dividend program, the Company declared a dividend of $0.03 per common share payable on December 15, 2022 to shareholders of record at the close of business on December 1, 2022.
Operating results
Mine-by-mine summaries for 2022 third-quarter operating results may be found on pages 13 and 17 of this news release. Highlights include the following:
At Tasiast, production was largely in line with the previous two quarters, and higher year-over-year due to the temporary suspension of milling operations in June 2021. During the third quarter, planned mill availability, throughput and recovery were lower than expected due to some commissioning challenges. Three new leach tanks were brought online in September and October, which has enabled a new pre-oxidation stage and increased retention time, and is expected to drive higher recoveries. Higher recoveries and mill throughput are expected to result in an increase in fourth quarter production.
Cost of sales per ounce sold was lower quarter-over-quarter due to lower operating waste mined, and lower year-over-year due to the increase in production as a result of the temporary suspension of milling operations in 2021. Cost of sales per ounce sold is expected to decrease in the fourth quarter with the anticipated increase in production.
Paracatu performed well during the quarter, increasing production significantly compared with Q2 2022 and Q3 2021 mainly as a result of higher grade and higher recoveries, with continued high-grade material expected for the remainder of the year driving a further increase in production. Cost of sales per ounce sold was lower quarter-over-quarter mainly due to the increase in production and higher year-over-year mainly due to inflationary pressure on consumables, contractors, labour and maintenance costs.
At Fort Knox, production was largely in line with Q2 2022, and increased compared with Q3 2021 primarily due to higher mill throughput. The site had another strong quarter of stacking onto the leach pad, and solution grades from heap leach processing are increasing, positioning Q4 to be another strong quarter. Cost of sales per ounce sold was in line quarter-over-quarter and increased year-over-year primarily due to inflationary pressure on consumables and higher contractor costs.
At Round Mountain, production was higher than the previous quarter mainly due to more ounces recovered from the heap leach pads, and year-over-year production was largely in line. Cost of sales per ounce sold was lower quarter-over-quarter mainly due to higher production, and higher year-over-year related to inflationary cost pressures on consumables.
The Company has completed the Round Mountain optimization program, which evaluated four primary options to exploit the significant resources at the site: Phase S open pit pushback, Phase W3 open pit pushback, Phase X underground, and Gold Hill underground.
Given the high levels of inflation experienced in Nevada, and the Company’s focus on capital discipline, cash flow generation, and resiliency, Kinross is prioritizing the underground opportunities at Phase X and Gold Hill, and continuing to mine Phase W (W1 and W2). The expansion opportunities at Phase W3 and Phase S have been deferred, and the associated ounces will remain in reserves and could potentially be exploited in the future as the environment improves. The two underground opportunities show potential for higher-margin, higher-return operations at Round Mountain compared to open pit, along with increased flexibility and optionality. A team with underground expertise has been assembled and the Company will be in position to start construction of an underground decline at Phase X next year.
Bald Mountain performed well during the quarter, with production increasing and cost of sales per ounce sold decreasing compared with Q2 2022. The quarter-over-quarter production increase was mainly due to more ounces recovered from the heap leach pads, partially offset by lower grades, while cost of sales per ounce was down mainly as a result of higher capitalized stripping. Year-over-year production was higher primarily due to more ounces recovered from the heap leach pads and, for the same time period, cost of sales per ounce sold was higher largely as a result of inflationary pressure on consumables.
At La Coipa, production increased significantly compared to the second quarter as the mill continued to ramp up and resolve commissioning challenges, and cost of sales per ounce sold were lower quarter-over-quarter mainly due to higher production. The pump and supply chain issues encountered earlier in the year have largely been resolved, with mill throughput steadily increasing month-over-month and October averaging approximately 9,500 tonnes per day (t/d) with multiple days at or above 13,000 t/d. The mill is now expected to steadily increase to a sustained design capacity of 13,000 t/d by the end of Q1 2023.
Development projects
Tasiast
The Tasiast 24k project continues to progress on schedule to reach throughput of 24,000 t/d by mid-2023. Following project completion, it is expected that a ramp-up period will see 24,000 t/d plant throughput transitioning from an intermittent to consistent basis by the end of the year. Procurement is substantially complete, with all major equipment either on site or expected to arrive by year-end. Construction has commenced, and civil and concrete works are well advanced.
The 34MW Tasiast solar power plant continues to advance and is on schedule for completion in the second half of 2023. Engineering design is essentially complete and focused on deliverables for integration, procurement is well advanced with all long-lead critical procurement items ordered and site preparation started in October. The solar project is contributing to the Company’s efforts to reduce its greenhouse gas emissions and is expected to provide approximately 20% of the site’s power.
Great Bear
At the Great Bear project in Red Lake, Ontario, the Company continues to make excellent progress and is on schedule to declare an initial mineral resource in early 2023. The Company also plans to issue a Technical Report to support the resource.
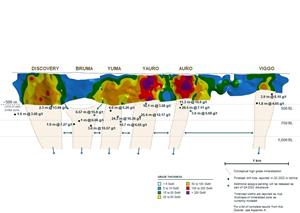
To date, Kinross has drilled approximately 160,000 metres and is on track to complete at least 200,000 metres of exploration and infill drilling in 2022 at the Limb and LP Fault zones. Since its last update on July 27, 2022, the Company has received additional assay results, with a selection of the new results from targets at the LP Fault zone highlighted in the table below.
Drilling results continue to support the view of a high-grade, world-class deposit that underpins the prospect of a large, long-life mining complex. Results have also confirmed gold mineralization with good widths and high grades, including high-grade mineralization at depths of more than 500 metres. These results support the view that the LP Fault zone can support a long-life, high-grade, open-pit and underground mine. The initial results from the recently-completed 35,000 metre grade control drill program have also helped confirm the high grade, continuous nature of the intercepts observed in the LP Fault zone.
The Company is also analyzing an advanced exploration program that would establish an underground decline and allow for more efficient exploration of deeper areas of the LP Fault, along with the nearby Hinge and Limb gold zones, as well as bulk sampling. The Company is targeting a potential start of the advanced program as early as 2024.
Baseline environmental surveys, local community socio-economic studies and engineering activities required for the permitting process are progressing well. Kinross continues to advance its comprehensive local outreach and engagement program for all Red Lake regional communities, including the establishment of a community office. The Company is taking steps to build technical capacity and active site participation in the area of environmental monitoring with Wabauskang and Lac Seul First Nation partners, on whose traditional territories the project is located.
Selected Great Bear Drill Results
See Appendix A for full results.
| Hole ID | From (m) | To (m) | Width (m) | True Width (m) | Au (g/t) | Target | |
| BR-545 | 428.5 | 453.8 | 25.3 | 24.5 | 3.64 | Yauro | |
| BR-545 | including | 429.5 | 431.4 | 1.95 | 1.8 | 36.34 | |
| BR-545 | and | 459.5 | 472.8 | 13.35 | 10.3 | 0.38 | |
| BR-545 | and | 486.9 | 492.5 | 5.6 | 5.0 | 0.60 | |
| BR-576 | 666.8 | 670.0 | 3.25 | 2.8 | 0.60 | Yuma | |
| BR-576 | and | 703.0 | 711.1 | 8.1 | 7.1 | 11.83 | |
| BR-576 | including | 704.0 | 707.0 | 3 | 2.8 | 29.54 | |
| BR-576 | and | 742.3 | 755.3 | 13 | 10.3 | 0.43 | |
| BR-576 | and | 809.7 | 815.7 | 6 | 5.0 | 0.59 | |
| BR-596 | 687.1 | 694.5 | 7.4 | 6.6 | 3.73 | Yuma | |
| BR-596 | including | 687.1 | 691.0 | 3.9 | 3.7 | 6.85 | |
| BR-596 | and | 701.0 | 738.8 | 37.75 | 28.3 | 1.03 | |
| BR-612 | 399.0 | 412.5 | 13.5 | 12.7 | 1.91 | Auro | |
| BR-612 | including | 402.0 | 405.0 | 3 | 2.8 | 4.27 | |
| BR-612 | and | 436.0 | 441.0 | 5 | 4.1 | 19.97 | |
| BR-612 | including | 436.0 | 439.5 | 3.5 | 3.1 | 27.77 | |
| BR-612 | and | 461.0 | 466.6 | 5.6 | 4.1 | 1.39 | |
| BR-621 | 174.0 | 178.6 | 4.6 | 4.2 | 0.67 | Auro | |
| BR-621 | and | 189.7 | 205.3 | 15.6 | 14.4 | 0.38 | |
| BR-621 | and | 245.3 | 250.0 | 4.7 | 3.8 | 0.68 | |
| BR-621 | and | 311.5 | 320.0 | 8.5 | 7.7 | 0.51 | |
| BR-621 | and | 330.0 | 374.9 | 44.9 | 43.1 | 2.27 | |
| BR-621 | including | 347.0 | 365.8 | 18.75 | 16.5 | 3.16 | |
| BR-621 | and including | 372.0 | 373.0 | 1 | 1.0 | 26.50 | |
| BR-621 | and | 468.0 | 471.9 | 3.9 | 3.6 | 0.62 | |
| BR-621 | and | 480.5 | 495.0 | 14.5 | 11.2 | 0.48 | |
| BR-623 | 545.0 | 551.0 | 6 | 4.4 | 2.03 | Auro | |
| BR-623 | and | 578.0 | 608.8 | 30.75 | 22.8 | 7.62 | |
| BR-623 | including | 585.7 | 597.0 | 11.3 | 10.9 | 18.60 | |
| BR-623 | and | 627.3 | 628.0 | 0.75 | 0.7 | 18.90 | |
| BR-623 | and | 755.0 | 763.3 | 8.3 | 7.1 | 0.36 | |
| BR-623 | and | 806.7 | 809.6 | 2.95 | 2.8 | 3.23 | |
| BR-624 | 634.8 | 652.0 | 17.2 | 13.4 | 0.43 | Auro | |
| BR-624 | and | 670.0 | 698.5 | 28.5 | 23.1 | 7.11 | |
| BR-624 | including | 677.1 | 684.0 | 6.95 | 5.1 | 26.83 | |
| BR-624 | and | 823.0 | 832.0 | 9.05 | 7.5 | 0.58 | |
| BR-700 | 682.8 | 761.3 | 78.5 | 65.9 | 0.67 | Yuma | |
| BR-700 | and | 802.0 | 817.0 | 15 | 11.9 | 1.88 | |
| BR-700 | including | 812.1 | 813.7 | 1.6 | 1.2 | 15.10 | |
| BR-700 | and | 924.4 | 932.0 | 7.6 | 5.9 | 0.44 | |
| BR-700 | and | 940.7 | 945.5 | 4.75 | 4.1 | 0.45 |
Results are preliminary in nature and are subject to on-going QA/QC.
See Appendix B for a LP Fault zone long section.
See Appendix C for a visual representation of the conceptual geological interpretation of the potential Great Bear deposit.
View an interactive 3D model of the Great Bear project here:
https://vrify.com/decks/Great-Bear-Project-Ontario-Canada-September-15-2022 (Updated to September 15, 2022).
Manh Choh
On July 27, 2022, the Company, as the operator of the joint venture, announced that it will proceed with development of the 70%-owned Manh Choh project in Alaska. The project is expected to increase the Company’s production profile in Alaska by a total of approximately 640,000 attributable Au eq. oz. over the life of mine at lower costs. Initial production from Manh Choh is expected in the second half of 2024.
Early works at Manh Choh are focused on camp and initial road access, which are proceeding on schedule and on budget. At Fort Knox foundation work for the processing infrastructure upgrades are underway. Permitting is progressing well and the Company received its wetland permit in the third quarter. Procurement and contracting activities are advancing well, prioritizing local employment and contracting, including with the Native Village of Tetlin.
Lobo-Marte
Kinross continues to advance permitting activities at Lobo-Marte in order to preserve its optionality for Kinross’ long-term portfolio. The Company continues to study opportunities to extend La Coipa’s mine life up to the end of the decade, with the potential additions of a new Puren pushback, as well as the adjacent Coipa Norte and Can-Can pushbacks. Those extensions would enter into the regular permitting cycle in the upcoming years. As a result, the Company has decided to defer submission of the Lobo-Marte Environmental Impact Assessment (EIA), as the content of that application will depend, in part, on the extent of any mine life extensions at La Coipa and other factors such as gold price, local permitting process, and other economic considerations. The Company continues to believe in the project’s long-term development potential as a large, low-cost mine upon the conclusion of mining at La Coipa.
Curlew Basin exploration
At the Curlew exploration project in Washington State, located approximately 35 kilometres north of the Company’s Kettle River mill by paved road, drilling from underground has confirmed the understanding of mineralized vein orientations. The Company is on schedule to declare a mineral resource in early 2023 with the drilling information to date. Underground exploration drilling is still underway and will continue into 2023 after which an updated resource will be presented at a later date as the project is expected to grow beyond the year-end resource.
Exploration drill results received during the quarter include:
- Hole # 1116 – 2.4m @ 11.59 g/t Au – West Zone target
- Hole # 1118– 2.9m @ 7.12 g/t Au – Stealth target
- Hole # 1120– 5.2m @ 5.37 g/t Au – LP target
Round Mountain Gold Hill exploration
At the Gold Hill exploration project, located approximately seven kilometres northeast of Round Mountain in Nevada, exploration drilling continued to return encouraging results. Drilling at the main zone (extension of the Gold Hill pit) has confirmed multiple >150m strike and dip extensions of the primary vein and parallel vein structures. Results received this quarter include:
- D-1175 – 2.5m @ 8.04 g/t Au (incl. 0.8m @ 23.3 g/t Au)
- D-1173A – 2.3m @ 6.93 g/t Au (incl. 0.3m @ 36.90 g/t Au)
Drilling along the parallel Alexandria vein (600m south of Main) has also returned encouraging results such as D-1176 – 1.9m @ 24.24g/t Au (Incl. 0.4m @ 107g/t Au), as well as visible gold in veins beneath the sinter (assays pending).
Gold Hill is a low sulfidation epithermal vein system consisting of high-grade narrow quartz veins with significant strike continuity. Historic underground mining (current pit area) produced approximately 40koz with a grade of 10g/t Au. Exploration this year focused on testing the strike and dip limits of Main and Alexandria, both of which remain open along strike. Exploration work will continue these efforts, as well as test for parallel veins outside of the two primary zones.
Company guidance
The following section of the news release represents forward-looking information and users are cautioned that actual results may vary. We refer to the risks and assumptions contained in the Cautionary Statement on Forward-Looking Information on page 30 of this news release. This Company Guidance section references all-in sustaining cost per equivalent ounce sold, which is a non-GAAP ratio with no standardized meaning under IFRS and therefore, may not be comparable to similar measures presented by other issuers. The definition of this non-GAAP ratio and comparable reconciliation is included on pages 18 to 23 of this news release.
The Company’s Russian and Ghanaian assets have been excluded from its guidance due to the classification of these assets as discontinued as at September 30, 2022.
As Kinross’ share of Chirano (90%) is excluded from guidance, all 2022 guidance figures are no longer on an attributable basis, but on a total basis.
Production guidance
The Company expects its 2022 production to be approximately 2 million Au eq. oz., mainly due to slower-than-expected ramp-up at La Coipa and challenges associated with commissioning the Tasiast 21k project.
Kinross previously guided 2.3 million and 2.1 million Au eq. oz. (+/- 5%) in 2023 and 2024, respectively. The Company now expects to produce approximately 2.1 million attributable9 Au eq. oz. in 2023 and 2024, respectively, and approximately 2 million attributable9 Au eq. oz. in 2025. This deferral of production is based on thorough assessments that have been completed by our new operations leadership with a focus on more resilient, balanced and de-risked mine plans.
Cost guidance12
The Company expects to be slightly above its revised 2022 production cost of sales guidance of approximately $900 per Au eq. oz. and in line with its revised all-in sustaining cost guidance of approximately $1,240 per Au eq. oz. sold2. In 20218, production cost of sales was $832 per Au eq. oz. and all-in sustaining cost was $1,138 per Au eq. oz. sold2.
________________________
12 Based on a gold price of $1,800 per ounce and an oil price of $100 per barrel (including a $10 per barrel change in the price of oil would be expected to result in an approximate $4 impact on fuel consumption costs on production cost of sales per ounce), as disclosed in Kinross’ Q2 2022 results news release from July 27, 2022. The other key assumptions and sensitivities disclosed in the Company’s original guidance on February 16, 2022 have not changed.
Capital expenditures guidance
Kinross expects its 2022 capital expenditures to be approximately $750 million mainly due to less capitalized stripping across the portfolio and delayed spending on the Tasiast solar power project. Capital expenditures from continuing operations was $822 million for the year ended December 31, 2021. Kinross’ previous 2022 guidance for capital expenditures was $850 million (+/- 5%).
Organizational update
On August 10, 2022, Kinross announced that it had completed the sale of all its interest in the Chirano mine in Ghana to Asante Gold Corporation for total consideration of $225 million in cash and shares. Kinross received $60 million in cash and approximately 35 million Asante common shares upon close, with the remainder in deferred payments.
Since completing the Chirano divestment, as well as completing the divestment of the Company’s assets in Russia on July 15, 2022, Kinross has adjusted its regional head office presence to be more in line with its Americas-focused portfolio. The optimized operating model is expected to keep our go-forward overhead costs at approximately the same per ounce level going forward as we had expected prior to the divestitures.
Further, during the quarter, the Company appointed Claude Schimper to the position of Executive Vice-President and Chief Operating Officer, where he will be responsible for the Company’s operational success. Ned Jalil, Senior Vice-President, Technical Services, has assumed leadership of Kinross’ project development, exploration, geology, metallurgy, mine planning, operations strategy and supply chain functions.
At Tasiast, the Company is engaged in discussions with employee delegates regarding the collective labour agreement, which is set to expire at year-end.
Environment, Social and Governance (ESG) update
Following the publication of Kinross’ 2021 Sustainability and Climate reports in Q1 and Q2 respectively, the Company updated its contributions towards the Sustainable Development Goals developed by the United Nations as important societal goals, including a summary of results at the Chirano mine in Ghana, which was sold during the quarter.
In Mauritania, severe flooding in the Inchiri region in early September affected local cities and communities around the Tasiast mine, including the regional hospital. Kinross provided significant and timely humanitarian relief including food and supplies, as well as the delivery of a container of medical supplies and equipment through our partnership with health NGO, Project C.U.R.E., with a value of approximately $450,000.
Advancing our climate change strategy, Kinross completed an analysis of climate-related scenarios, following the governance recommendations of the Task Force on Climate-related Financial Disclosures. The Company also continued to advance its pipeline of energy efficiency projects, as well as strategic partnerships with various technology providers, Original Equipment Manufacturers and electric utilities. We have continued to improve our governance of climate change risks and opportunities by embedding the forecasting of emissions directly into the life of mine models of each of our assets and projects.
Kinross’ strong ESG performance was externally-recognized in major ESG rankings and ratings. The Company’s S&P Global ESG score increased three points in 2022, ranking in the 96th percentile, the Company’s highest score since 2014, which was driven primarily by improved scores in the Environment dimension. The Company’s Sustainalytics risk rating improved to medium from high and its MSCI score was maintained at “A.”
Conference call details
In connection with this news release, Kinross will hold a conference call and audio webcast on Thursday, November 10, 2022 at 8:00 a.m. EDT to discuss the results, followed by a question-and-answer session. To access the call, please dial:
Canada & US toll-free – +1 (888) 330-2446; Passcode: 4915537
Outside of Canada & US – +1 (240) 789-2732; Passcode: 4915537
Replay (available up to 14 days after the call):
Canada & US toll-free – +1 (800) 770-2030; Passcode: 4915537
Outside of Canada & US – +1 (647) 362-9199; Passcode: 4915537
You may also access the conference call on a listen-only basis via webcast at our website www.kinross.com. The audio webcast will be archived on www.kinross.com.
This release should be read in conjunction with Kinross’ 2022 third-quarter unaudited Financial Statements and Management’s Discussion and Analysis report at www.kinross.com. Kinross’ 2022 third-quarter unaudited Financial Statements and Management’s Discussion and Analysis have been filed with Canadian securities regulators (available at www.sedar.com) and furnished with the U.S. Securities and Exchange Commission (available at www.sec.gov). Kinross shareholders may obtain a copy of the financial statements free of charge upon request to the Company.
About Kinross Gold Corporation
Kinross is a Canadian-based global senior gold mining company with operations and projects in the United States, Brazil, Mauritania, Chile and Canada. Our focus is on delivering value based on the core principles of responsible mining, operational excellence, disciplined growth, and balance sheet strength. Kinross maintains listings on the Toronto Stock Exchange (symbol:K) and the New York Stock Exchange (symbol:KGC).
Media Contact
Samantha Sheffield
Senior Manager, Corporate Communications
phone: 416-365-3034
samantha.sheffield@kinross.com
Investor Relations Contact
Chris Lichtenheldt
Vice-President, Investor Relations
phone: 416-365-2761
chris.lichtenheldt@kinross.com
Review of operations
| Three months ended September 30, (unaudited) | Gold equivalent ounces | ||||||||||||||
| Produced | Sold | Production cost of sales ($millions) | Production cost of sales/equivalent ounce sold | ||||||||||||
| 2022 | 2021 | 2022 | 2021 | 2022 | 2021 | 2022 | 2021 | ||||||||
| Fort Knox | 75,522 | 71,336 | 74,221 | 71,482 | $ | 88.6 | $ | 67.7 | $ | 1,194 | $ | 947 | |||
| Round Mountain | 62,417 | 63,242 | 61,757 | 61,405 | 87.0 | 60.8 | 1,409 | 990 | |||||||
| Bald Mountain | 65,394 | 55,559 | 52,472 | 52,874 | 51.2 | 48.8 | 976 | 923 | |||||||
| Paracatu | 159,113 | 134,425 | 152,616 | 133,924 | 131.1 | 103.7 | 859 | 774 | |||||||
| La Coipa | 33,955 | - | 24,681 | - | 12.1 | - | 490 | - | |||||||
| Maricunga | - | - | 652 | 655 | 0.5 | 0.5 | 767 | 763 | |||||||
| Americas Total | 396,401 | 324,562 | 366,399 | 320,340 | 370.5 | 281.5 | 1,011 | 879 | |||||||
| Tasiast | 132,754 | 3,847 | 128,014 | 4,822 | 94.8 | 8.3 | 741 | 1,721 | |||||||
| West Africa Total | 132,754 | 3,847 | 128,014 | 4,822 | 94.8 | 8.3 | 741 | 1,721 | |||||||
| Continuing Operations Total | 529,155 | 328,409 | 494,413 | 325,162 | 465.3 | 289.8 | 941 | 891 | |||||||
| Discontinued Operations | |||||||||||||||
| Kupol | - | 120,822 | - | 121,798 | - | 81.8 | $ | - | $ | 672 | |||||
| Chirano (100%) | 13,522 | 37,588 | 15,018 | 34,999 | 24.3 | 49.4 | 1,618 | 1,411 | |||||||
| 13,522 | 158,410 | 15,018 | 156,797 | 24.3 | 131.2 | ||||||||||
| Nine months ended September 30, (unaudited) | Gold equivalent ounces | ||||||||||||||
| Produced | Sold | Production cost of sales ($millions) | Production cost of sales/equivalent ounce sold | ||||||||||||
| 2022 | 2021 | 2022 | 2021 | 2022 | 2021 | 2022 | 2021 | ||||||||
| Fort Knox | 207,509 | 190,453 | 204,732 | 189,206 | $ | 248.6 | $ | 193.1 | $ | 1,214 | $ | 1,021 | |||
| Round Mountain | 164,445 | 205,456 | 160,171 | 207,218 | 214.1 | 184.1 | 1,337 | 888 | |||||||
| Bald Mountain | 155,573 | 143,854 | 147,961 | 142,507 | 146.0 | 127.4 | 987 | 894 | |||||||
| Paracatu | 396,545 | 411,891 | 387,974 | 404,209 | 367.3 | 295.2 | 947 | 730 | |||||||
| La Coipa | 41,893 | - | 31,780 | - | 17.8 | - | 560 | - | |||||||
| Maricunga | - | - | 2,328 | 1,966 | 1.5 | 1.4 | 644 | 712 | |||||||
| Americas Total | 965,965 | 951,654 | 934,946 | 945,106 | 995.3 | 801.2 | 1,065 | 848 | |||||||
| Tasiast | 395,589 | 155,249 | 372,273 | 159,187 | 283.9 | 112.8 | 763 | 709 | |||||||
| West Africa Total | 395,589 | 155,249 | 372,273 | 159,187 | 283.9 | 112.8 | 763 | 709 | |||||||
| Continuing Operations Total | 1,361,554 | 1,106,903 | 1,307,219 | 1,104,293 | 1,279.2 | 914.0 | 979 | 828 | |||||||
| Discontinued Operations | |||||||||||||||
| Kupol | 169,156 | 364,929 | 122,295 | 365,075 | 83.8 | 231.0 | 685 | 633 | |||||||
| Chirano (100%) | 82,060 | 120,107 | 87,823 | 116,660 | 131.2 | 155.9 | 1,494 | 1,336 | |||||||
| 251,216 | 485,036 | 210,118 | 481,735 | 215.0 | 386.9 | ||||||||||
Interim condensed consolidated balance sheets
| (unaudited, expressed in millions of U.S. dollars, except share amounts) | |||||||||
| As at | |||||||||
| September 30, 2022 | December 31, 2021 | ||||||||
| Assets | |||||||||
| Current assets | |||||||||
| Cash and cash equivalents | $ | 488.4 | $ | 531.5 | |||||
| Restricted cash | 8.2 | 11.4 | |||||||
| Accounts receivable and other assets | 292.2 | 214.5 | |||||||
| Current income tax recoverable | 6.5 | 10.2 | |||||||
| Inventories | 1,092.1 | 1,151.3 | |||||||
| Unrealized fair value of derivative assets | 26.7 | 30.0 | |||||||
| 1,914.1 | 1,948.9 | ||||||||
| Non-current assets | |||||||||
| Property, plant and equipment | 7,860.3 | 7,617.7 | |||||||
| Goodwill | - | 158.8 | |||||||
| Long-term investments | 99.0 | 98.2 | |||||||
| Other long-term assets | 666.1 | 598.0 | |||||||
| Deferred tax assets | - | 6.5 | |||||||
| Total assets | $ | 10,539.5 | $ | 10,428.1 | |||||
| Liabilities | |||||||||
| Current liabilities | |||||||||
| Accounts payable and accrued liabilities | $ | 495.6 | $ | 492.70 | |||||
| Current income tax payable | 52.6 | 95.00 | |||||||
| Current portion of long-term debt and credit facilities | 40.0 | 40.00 | |||||||
| Current portion of provisions | 35.8 | 90.00 | |||||||
| Other current liabilities | 19.1 | 23.70 | |||||||
| 643.1 | 741.40 | ||||||||
| Non-current liabilities | |||||||||
| Long-term debt and credit facilities | 2,471.6 | 1,589.90 | |||||||
| Provisions | 678.1 | 847.90 | |||||||
| Long-term lease liabilities | 25.50 | 35.10 | |||||||
| Other long-term liabilities | 131.20 | 127.40 | |||||||
| Deferred tax liabilities | 356.80 | 436.80 | |||||||
| Total liabilities | $ | 4,306.30 | $ | 3,778.50 | |||||
| Equity | |||||||||
| Common shareholders' equity | |||||||||
| Common share capital | $ | 4,679.60 | $ | 4,427.70 | |||||
| Contributed surplus | 10,675.00 | 10,664.40 | |||||||
| Accumulated deficit | (9,108.50 | ) | (8,492.40 | ) | |||||
| Accumulated other comprehensive income (loss) | (69.20 | ) | (18.80 | ) | |||||
| Total common shareholders' equity | 6,176.90 | 6,580.90 | |||||||
| Non-controlling interests | 56.30 | 68.70 | |||||||
| Total equity | 6,233.20 | 6,649.60 | |||||||
| Total liabilities and equity | $ | 10,539.50 | $ | 10,428.10 | |||||
| Common shares | |||||||||
| Authorized | Unlimited | Unlimited | |||||||
| Issued and outstanding | 1,285,406,778 | 1,244,332,772 | |||||||
Interim condensed consolidated statements of operations
| (unaudited, expressed in millions of U.S. dollars, except share and per share amounts) | |||||||||||||||||
| Three months ended | Nine months ended | ||||||||||||||||
| September 30, | September 30, | September 30, | September 30, | ||||||||||||||
| 2022 | 2021 | 2022 | 2021 | ||||||||||||||
| Revenue | |||||||||||||||||
| Metal sales | $ | 856.5 | $ | 582.4 | $ | 2,378.9 | $ | 1,984.7 | |||||||||
| Cost of sales | |||||||||||||||||
| Production cost of sales | 465.3 | 289.8 | 1,279.2 | 914.0 | |||||||||||||
| Depreciation, depletion and amortization | 185.1 | 173.2 | 532.1 | 530.3 | |||||||||||||
| Total cost of sales | 650.4 | 463.0 | 1,811.3 | 1,444.3 | |||||||||||||
| Gross profit | 206.1 | 119.4 | 567.6 | 540.4 | |||||||||||||
| Other operating expense | 12.2 | 92.3 | 83.7 | 181.7 | |||||||||||||
| Exploration and business development | 42.3 | 24.4 | 105.6 | 63.4 | |||||||||||||
| General and administrative | 40.3 | 26.4 | 100.5 | 85.5 | |||||||||||||
| Operating earnings (loss) | 111.3 | (23.7 | ) | 277.8 | 209.8 | ||||||||||||
| Other income (expense) - net | 5.6 | 3.3 | (0.4 | ) | (8.7 | ) | |||||||||||
| Finance income | 6.5 | 1.2 | 10.7 | 4.1 | |||||||||||||
| Finance expense | (23.3 | ) | (18.5 | ) | (68.0 | ) | (56.0 | ) | |||||||||
| Earnings (loss) from continuing operations before tax | 100.1 | (37.7 | ) | 220.1 | 149.2 | ||||||||||||
| Income tax expense - net | (34.5 | ) | (35.4 | ) | (82.7 | ) | (113.6 | ) | |||||||||
| Earnings (loss) from continuing operations after tax | 65.6 | (73.1 | ) | 137.4 | 35.6 | ||||||||||||
| Earnings (loss) from discontinued operations after tax | (0.8 | ) | 27.2 | (636.3 | ) | 186.1 | |||||||||||
| Net earnings (loss) | $ | 64.8 | $ | (45.9 | ) | $ | (498.9 | ) | $ | 221.7 | |||||||
| Net earnings (loss) from continuing operations attributable to: | |||||||||||||||||
| Non-controlling interests | $ | (0.3 | ) | $ | (0.2 | ) | $ | (0.5 | ) | $ | (0.7 | ) | |||||
| Common shareholders | $ | 65.9 | $ | (72.9 | ) | $ | 137.9 | $ | 36.3 | ||||||||
| Net earnings (loss) from discontinued operations attributable to: | |||||||||||||||||
| Non-controlling interests | $ | 0.2 | $ | (0.8 | ) | $ | 0.8 | $ | (1.5 | ) | |||||||
| Common shareholders | $ | (1.0 | ) | $ | 28.0 | $ | (637.1 | ) | $ | 187.6 | |||||||
| Net earnings (loss) attributable to: | |||||||||||||||||
| Non-controlling interests | $ | (0.1 | ) | $ | (1.0 | ) | $ | 0.3 | $ | (2.2 | ) | ||||||
| Common shareholders | $ | 64.9 | $ | (44.9 | ) | $ | (499.2 | ) | $ | 223.9 | |||||||
| Earnings (loss) per share from continuing operations attributable to common shareholders | |||||||||||||||||
| Basic | $ | 0.05 | $ | (0.06 | ) | $ | 0.11 | $ | 0.03 | ||||||||
| Diluted | $ | 0.05 | $ | (0.06 | ) | $ | 0.11 | $ | 0.03 | ||||||||
| Earnings (loss) per share from discontinued operations attributable to common shareholders | $ | - | $ | 0.02 | $ | (0.49 | ) | $ | 0.15 | ||||||||
| Basic | $ | - | $ | 0.02 | $ | (0.49 | ) | $ | 0.15 | ||||||||
| Diluted | |||||||||||||||||
| Earnings (loss) per share attributable to common shareholders | |||||||||||||||||
| Basic | $ | 0.05 | $ | (0.04 | ) | $ | (0.39 | ) | $ | 0.18 | |||||||
| Diluted | $ | 0.05 | $ | (0.04 | ) | $ | (0.39 | ) | $ | 0.18 | |||||||
Interim condensed consolidated statements of cash flows
| (unaudited, expressed in millions of U.S. dollars) | |||||||||||||||||
| Three months ended | Nine months ended | ||||||||||||||||
| September 30, | September 30, | September 30, | September 30, | ||||||||||||||
| 2022 | 2021 | 2022 | 2021 | ||||||||||||||
| Net inflow (outflow) of cash related to the following activities: | |||||||||||||||||
| Operating: | |||||||||||||||||
| Earnings (loss) from continuing operations after tax | $ | 65.6 | $ | (73.1 | ) | $ | 137.4 | $ | 35.6 | ||||||||
| Adjustments to reconcile net earnings (loss) from continuing operations to net cash provided from operating activities: | |||||||||||||||||
| Depreciation, depletion and amortization | 185.1 | 173.2 | 532.1 | 530.3 | |||||||||||||
| Share-based compensation expense | 1.4 | 2.4 | 7.4 | 8.4 | |||||||||||||
| Finance expense | 23.3 | 18.5 | 68.0 | 56.0 | |||||||||||||
| Deferred tax expense | 5.5 | 8.2 | 3.4 | 4.5 | |||||||||||||
| Foreign exchange (gains) losses and other | (1.5 | ) | 12.1 | 8.2 | 36.9 | ||||||||||||
| Reclamation (recovery) expense | (20.0 | ) | - | 3.9 | - | ||||||||||||
| Changes in operating assets and liabilities: | |||||||||||||||||
| Accounts receivable and other assets | (15.6 | ) | (11.3 | ) | - | 47.0 | (2.0 | ) | |||||||||
| Inventories | (70.0 | ) | (11.6 | ) | (222.4 | ) | (71.2 | ) | |||||||||
| Accounts payable and accrued liabilities | 12.9 | 32.6 | 64.0 | 81.3 | |||||||||||||
| Cash flow provided from operating activities | 186.7 | 151.0 | 649.0 | 679.8 | |||||||||||||
| Income taxes paid | (13.5 | ) | (10.7 | ) | (120.8 | ) | (132.7 | ) | |||||||||
| Net cash flow of continuing operations provided from operating activities | 173.2 | 140.3 | 528.2 | 547.1 | |||||||||||||
| Net cash flow of discontinued operations (used in) provided from operating activities | (1.6 | ) | 129.6 | 47.6 | 390.8 | ||||||||||||
| Investing: | |||||||||||||||||
| Additions to property, plant and equipment | (197.3 | ) | (203.8 | ) | (447.4 | ) | (566.0 | ) | |||||||||
| Interest paid capitalized to property, plant and equipment | (20.5 | ) | (13.0 | ) | (36.7 | ) | (43.2 | ) | |||||||||
| Acquisitions net of cash acquired | - | - | (1,027.5 | ) | - | ||||||||||||
| Net additions to long-term investments and other assets | (9.5 | ) | (12.4 | ) | (43.6 | ) | (28.9 | ) | |||||||||
| (Increase) decrease in restricted cash - net | (1.2 | ) | 0.5 | (2.3 | ) | - | |||||||||||
| Interest received and other - net | 2.0 | (2.4 | ) | 6.7 | (1.4 | ) | |||||||||||
| Net cash flow of continuing operations used in investing activities | (226.5 | ) | (231.1 | ) | (1,550.8 | ) | (639.5 | ) | |||||||||
| Net cash flow of discontinued operations provided from (used in) investing activities | 43.3 | (27.9 | ) | 296.2 | (215.1 | ) | |||||||||||
| Financing: | |||||||||||||||||
| Proceeds from drawdown of debt | 100.0 | - | 1,197.6 | - | |||||||||||||
| Repayment of debt | (200.0 | ) | - | (320.0 | ) | (500.0 | ) | ||||||||||
| Interest paid | (26.2 | ) | (20.0 | ) | (51.8 | ) | (46.9 | ) | |||||||||
| Payment of lease liabilities | (6.0 | ) | (8.5 | ) | (17.1 | ) | (24.1 | ) | |||||||||
| Dividends paid to common shareholders | (39.0 | ) | (37.8 | ) | (116.9 | ) | (113.5 | ) | |||||||||
| Repurchase and cancellation of shares | (60.2 | ) | (31.8 | ) | (60.2 | ) | (31.8 | ) | |||||||||
| Other - net | (4.9 | ) | (1.0 | ) | 3.9 | 7.9 | |||||||||||
| Net cash flow of continuing operations (used in) provided from financing activities | (236.3 | ) | (99.1 | ) | 635.5 | (708.4 | ) | ||||||||||
| Net cash flow of discontinued operations used in financing activities | - | - | - | - | |||||||||||||
| Effect of exchange rate changes on cash and cash equivalents of continuing operations | (1.0 | ) | (0.5 | ) | (1.4 | ) | (0.5 | ) | |||||||||
| Effect of exchange rate changes on cash and cash equivalents of discontinued operations | (0.3 | ) | (0.8 | ) | 1.6 | 0.8 | |||||||||||
| Decrease in cash and cash equivalents | (249.2 | ) | (89.5 | ) | (43.1 | ) | (624.8 | ) | |||||||||
| Cash and cash equivalents, beginning of period | 719.1 | 675.6 | 531.5 | 1,210.9 | |||||||||||||
| Cash and cash equivalents of assets held for sale, beginning of period | 18.5 | - | - | - | |||||||||||||
| Cash and cash equivalents, end of period | $ | 488.4 | $ | 586.1 | $ | 488.4 | $ | 586.1 | |||||||||
| Operating Summary | |||||||||||||||||||
| Mine | Period | Tonnes Ore Mined (d) | Ore Processed (Milled) | Ore Processed (Heap Leach) | Grade (Mill) (d) | Grade (Heap Leach) | Recovery (a)(d) | Gold Eq Production (b) | Gold Eq Sales (b) | Production cost of sales | Production cost of sales/oz (c) | Total Cap Ex (e) | DD&A | ||||||
| ('000 tonnes) | ('000 tonnes) | ('000 tonnes) | (g/t) | (g/t) | (%) | (ounces) | (ounces) | ($ millions) | ($/ounce) | ($ millions) | ($ millions) | ||||||||
| Americas | Fort Knox | Q3 2022 | 15,547 | 2,477 | 13,120 | 0.71 | 0.21 | 80 | % | 75,522 | 74,221 | $ | 88.6 | $ | 1,194 | $ | 31.0 | $ | 21.8 |
| Q2 2022 | 14,591 | 2,260 | 12,785 | 0.72 | 0.19 | 81 | % | 77,184 | 77,698 | $ | 92.6 | $ | 1,192 | $ | 13.1 | $ | 26.1 | ||
| Q1 2022 | 13,743 | 1,852 | 13,010 | 0.66 | 0.17 | 80 | % | 54,803 | 52,813 | $ | 67.4 | $ | 1,276 | $ | 2.9 | $ | 20.9 | ||
| Q4 2021 | 9,203 | 2,148 | 8,185 | 0.73 | 0.19 | 82 | % | 73,830 | 74,384 | $ | 74.1 | $ | 996 | $ | 31.6 | $ | 30.9 | ||
| Q3 2021 | 8,024 | 2,221 | 6,395 | 0.77 | 0.20 | 82 | % | 71,336 | 71,482 | $ | 67.7 | $ | 947 | $ | 37.4 | $ | 29.7 | ||
| Round Mountain | Q3 2022 | 8,856 | 1,021 | 8,336 | 0.64 | 0.27 | 79 | % | 62,417 | 61,757 | $ | 87.0 | $ | 1,409 | $ | 24.7 | $ | 17.6 | |
| Q2 2022 | 6,702 | 945 | 6,515 | 0.67 | 0.32 | 78 | % | 56,709 | 51,455 | $ | 74.8 | $ | 1,454 | $ | 20.6 | $ | 11.7 | ||
| Q1 2022 | 3,767 | 929 | 3,208 | 0.80 | 0.36 | 79 | % | 45,319 | 46,959 | $ | 52.3 | $ | 1,114 | $ | 16.0 | $ | 12.1 | ||
| Q4 2021 | 1,755 | 1,057 | 1,529 | 0.64 | 0.33 | 75 | % | 51,549 | 52,723 | $ | 51.8 | $ | 982 | $ | 50.3 | $ | 14.5 | ||
| Q3 2021 | 1,531 | 915 | 4,442 | 0.63 | 0.29 | 76 | % | 63,242 | 61,405 | $ | 60.8 | $ | 990 | $ | 23.7 | $ | 16.3 | ||
| Bald Mountain | Q3 2022 | 4,152 | - | 4,152 | - | 0.37 | nm | 65,394 | 52,472 | $ | 51.2 | $ | 976 | $ | 28.2 | $ | 39.1 | ||
| Q2 2022 | 4,945 | - | 4,945 | - | 0.60 | nm | 54,108 | 54,472 | $ | 54.5 | $ | 1,001 | $ | 16.2 | $ | 38.4 | |||
| Q1 2022 | 3,870 | - | 3,870 | - | 0.63 | nm | 36,071 | 41,017 | $ | 40.3 | $ | 983 | $ | 5.8 | $ | 35.1 | |||
| Q4 2021 | 5,222 | - | 5,222 | - | 0.52 | nm | 61,036 | 53,559 | $ | 50.1 | $ | 935 | $ | 17.2 | $ | 57.2 | |||
| Q3 2021 | 5,941 | - | 5,941 | - | 0.46 | nm | 55,559 | 52,874 | $ | 48.8 | $ | 923 | $ | 7.7 | $ | 59.4 | |||
| Paracatu | Q3 2022 | 11,752 | 13,797 | - | 0.45 | - | 79 | % | 159,113 | 152,616 | $ | 131.1 | $ | 859 | $ | 33.6 | $ | 47.2 | |
| Q2 2022 | 11,011 | 15,133 | - | 0.35 | - | 75 | % | 129,423 | 133,472 | $ | 129.6 | $ | 971 | $ | 31.2 | $ | 46.0 | ||
| Q1 2022 | 6,165 | 13,645 | - | 0.33 | - | 75 | % | 108,009 | 101,886 | $ | 106.6 | $ | 1,046 | $ | 16.0 | $ | 39.6 | ||
| Q4 2021 | 13,036 | 15,451 | - | 0.35 | - | 77 | % | 138,669 | 145,691 | $ | 116.9 | $ | 802 | $ | 49.6 | $ | 47.7 | ||
| Q3 2021 | 14,107 | 15,085 | - | 0.37 | - | 76 | % | 134,425 | 133,924 | $ | 103.7 | $ | 774 | $ | 30.0 | $ | 44.5 | ||
| La Coipa | Q3 2022 | 1,079 | 637 | - | 1.19 | - | 83 | % | 33,955 | 24,681 | $ | 12.1 | $ | 490 | $ | 34.7 | $ | - | |
| Q2 2022 | 550 | 321 | - | 0.74 | - | 69 | % | 7,414 | 7,099 | $ | 5.6 | $ | 789 | $ | 39.0 | $ | - | ||
| Q1 2022 | 174 | 58 | - | nm | - | nm | 524 | - | $ | - | $ | - | $ | 35.8 | $ | - | |||
| Q4 2021 | nm | - | - | - | - | - | - | - | $ | - | $ | - | $ | 43.2 | $ | - | |||
| Q3 2021 | nm | - | - | - | - | - | - | - | $ | - | $ | - | $ | 28.1 | $ | - | |||
| West Africa | Tasiast | Q3 2022 | 4,437 | 1,741 | - | 2.72 | - | 89 | % | 132,754 | 128,014 | $ | 94.8 | $ | 741 | $ | 33.4 | $ | 58.0 |
| Q2 2022 | 3,053 | 1,680 | - | 2.51 | - | 89 | % | 129,140 | 114,064 | $ | 93.3 | $ | 818 | $ | 24.3 | $ | 56.4 | ||
| Q1 2022 | 3,462 | 1,524 | - | 2.54 | - | 94 | % | 133,695 | 130,195 | $ | 95.8 | $ | 736 | $ | 19.4 | $ | 57.1 | ||
| Q4 2021 | 1,061 | 1,068 | - | 1.50 | - | 94 | % | 15,253 | 15,006 | $ | 10.8 | $ | 720 | $ | 52.5 | $ | 13.1 | ||
| Q3 2021 | 822 | - | - | - | - | - | 3,847 | 4,822 | $ | 8.3 | $ | 1,721 | $ | 68.1 | $ | 21.3 | |||
(a) Due to the nature of heap leach operations, recovery rates at Bald Mountain cannot be accurately measured on a quarterly basis. Recovery rates at Fort Knox, Round Mountain and Tasiast represent mill recovery only.
(b) Gold equivalent ounces include silver ounces produced and sold converted to a gold equivalent based on the ratio of the average spot market prices for the commodities for each period. The ratios for the quarters presented are as follows: Q3 2022: 89.91:1; Q2 2022: 82.76:1; Q1 2022: 78.19:1; Q4 2021: 76.89:1; Q3 2021: 73.45:1.
(c) “Production cost of sales per equivalent ounce sold” is defined as production cost of sales divided by gold equivalent ounces sold.
(d) "nm" means not meaningful.
(e) "Capital expenditures" is as reported as “Additions to property, plant and equipment” on the interim condensed consolidated statements of cash flows.
Reconciliation of non-GAAP financial measures and ratios
The Company has included certain non-GAAP financial measures and ratios in this document. These measures and ratios are not defined under International Financial Reporting Standards (IFRS) and should not be considered in isolation. The Company believes that these financial measures and ratios, together with financial measures and ratios determined in accordance with IFRS, provide investors with an improved ability to evaluate the underlying performance of the Company. The inclusion of these financial measures and ratios is meant to provide additional information and should not be used as a substitute for performance measures prepared in accordance with IFRS. These financial measures and ratios are not necessarily standard and therefore may not be comparable to other issuers.
All the non-GAAP financial measures and ratios in this document are from continuing operations and exclude results from the Company’s Chirano and Russian operations due to the classification of these operations as discontinued. The comparative information has been recast to exclude Chirano and Russia. As a result of the exclusion of Chirano, the following non-GAAP financial measures and ratios are no longer on an attributable basis, but on a total basis: production cost of sales from continuing operations per ounce sold on a by-product basis and all-in-sustaining cost from continuing operations per equivalent ounce sold and per ounce sold on a by-product basis.
Adjusted net earnings from continuing operations attributable to common shareholders and adjusted net earnings from continuing operations per share are non-GAAP financial measures and ratios which determine the performance of the Company, excluding certain impacts which the Company believes are not reflective of the Company’s underlying performance for the reporting period, such as the impact of foreign exchange gains and losses, reassessment of prior year taxes and/or taxes otherwise not related to the current period, impairment charges (reversals), gains and losses and other one-time costs related to acquisitions, dispositions and other transactions, and non-hedge derivative gains and losses. Although some of the items are recurring, the Company believes that they are not reflective of the underlying operating performance of its current business and are not necessarily indicative of future operating results. Management believes that these measures and ratios, which are used internally to assess performance and in planning and forecasting future operating results, provide investors with the ability to better evaluate underlying performance, particularly since the excluded items are typically not included in public guidance. However, adjusted net earnings from continuing operations and adjusted net earnings from continuing operations per share measures and ratios are not necessarily indicative of net earnings from continuing operations and earnings per share measures and ratios as determined under IFRS.
The following table provides a reconciliation of net earnings (loss) from continuing operations to adjusted net earnings from continuing operations for the periods presented:
| (unaudited, expressed in millions of U.S dollars, except per share amounts) | Three months ended | Nine months ended | ||||||||||||
| September 30, | September 30, | |||||||||||||
| 2022 | 2021 | 2022 | 2021 | |||||||||||
| Net earnings (loss) from continuing operations attributable to common shareholders - as reported | $ | 65.9 | $ | (72.9 | ) | $ | 137.9 | $ | 36.3 | |||||
| Adjusting items: | ||||||||||||||
| Foreign exchange (gains) losses | (5.9 | ) | (5.6 | ) | (0.1 | ) | 1.5 | |||||||
| Foreign exchange losses (gains) on translation of tax basis and foreign exchange on deferred income taxes within income tax expense | 3.1 | 15.0 | (8.4 | ) | 9.5 | |||||||||
| Taxes in respect of prior periods | 5.0 | 4.4 | 15.8 | 17.0 | ||||||||||
| Reclamation (recovery) expense | (20.0 | ) | 15.0 | 3.9 | 25.0 | |||||||||
| Tasiast mill fire related costs | - | 28.9 | - | 41.0 | ||||||||||
| COVID-19 costs(a) | - | 4.1 | - | 13.1 | ||||||||||
| Round Mountain pit wall stabilization costs | - | 16.1 | - | 42.7 | ||||||||||
| Tasiast definitive agreement settlement | - | 10.0 | - | 10.0 | ||||||||||
| Other(b) | 16.9 | 4.7 | 21.4 | 5.6 | ||||||||||
| Tax effects of the above adjustments | 3.7 | (8.5 | ) | 4.4 | (18.3 | ) | ||||||||
| 2.8 | 84.1 | 37.0 | 147.1 | |||||||||||
| Adjusted net earnings from continuing operations attributable to common shareholders | $ | 68.7 | $ | 11.2 | $ | 174.9 | $ | 183.4 | ||||||
| Weighted average number of common shares outstanding - Basic | 1,299.8 | 1,261.2 | 1,288.0 | 1,260.6 | ||||||||||
| Adjusted net earnings from continuing operations per share | $ | 0.05 | $ | 0.01 | $ | 0.14 | $ | 0.15 | ||||||
| Basic earnings (loss) from continuing operations per share attributable to common shareholders | $ | 0.05 | $ | (0.06 | ) | $ | 0.11 | $ | 0.03 | |||||
(a) Includes COVID-19 related labour, health and safety, donations and other support program costs. For the third quarter and first nine months of 2022, adjusted net earnings has not been adjusted for COVID-19 related costs of $1.2 million and $8.0 million, respectively, incurred at operating sites.
(b) Other includes restructuring costs of $13.0 million for the third quarter and first nine months of 2022 as well as other various impacts, such as one-time costs at sites, and gains and losses on the sale of assets and hedges, which the Company believes are not reflective of the Company’s underlying performance for the reporting period.
Free cash flow from continuing operations is a non-GAAP financial measure and is defined as net cash flow of continuing operations provided from operating activities less additions to property, plant and equipment. The Company believes that this measure, which is used internally to evaluate the Company’s underlying cash generation performance and the ability to repay creditors and return cash to shareholders, provides investors with the ability to better evaluate the Company’s underlying performance. However, the free cash flow from continuing operations measure is not necessarily indicative of operating earnings or net cash flow of continuing operations provided from operating activities as determined under IFRS.
The following table provides a reconciliation of free cash flow from continuing operations for the periods presented:
| Three months ended | Nine months ended | |||||||||||||
| (unaudited, expressed in millions of U.S dollars) | September 30, | September 30, | ||||||||||||
| 2022 | 2021 | 2022 | 2021 | |||||||||||
| Net cash flow of continuing operations provided from operating activities - as reported | $ | 173.2 | $ | 140.3 | $ | 528.2 | $ | 547.1 | ||||||
| Less: Additions to property, plant and equipment | (197.3 | ) | (203.8 | ) | (447.4 | ) | (566.0 | ) | ||||||
| Free cash flow from continuing operations | $ | (24.1 | ) | $ | (63.5 | ) | $ | 80.8 | $ | (18.9 | ) | |||
Adjusted operating cash flow from continuing operations is a non-GAAP financial measure and is defined as net cash flow of continuing operations provided from operating activities excluding certain impacts which the Company believes are not reflective of the Company’s regular operating cash flow and excluding changes in working capital. Working capital can be volatile due to numerous factors, including the timing of tax payments. The Company uses adjusted operating cash flow from continuing operations internally as a measure of the underlying operating cash flow performance and future operating cash flow-generating capability of the Company. However, the adjusted operating cash flow from continuing operations measure is not necessarily indicative of net cash flow of continuing operations provided from operating activities as determined under IFRS.
The following table provides a reconciliation of adjusted operating cash flow from continuing operations for the periods presented:
| (unaudited, expressed in millions of U.S dollars) | Three months ended | Nine months ended | |||||||||||||
| September 30, | September 30, | ||||||||||||||
| 2022 | 2021 | 2022 | 2021 | ||||||||||||
| Net cash flow of continuing operations provided from operating activities - as reported | $ | 173.2 | $ | 140.3 | $ | 528.2 | $ | 547.1 | |||||||
| Adjusting items: | |||||||||||||||
| Working capital changes: | |||||||||||||||
| Accounts receivable and other assets | 15.6 | 11.3 | (47.0 | ) | 2.0 | ||||||||||
| Inventories | 70.0 | 11.6 | 222.4 | 71.2 | |||||||||||
| Accounts payable and other liabilities, including income taxes paid | 0.6 | (21.9 | ) | 56.8 | 51.4 | ||||||||||
| Total working capital changes | 86.2 | 1.0 | 232.2 | 124.6 | |||||||||||
| Adjusted operating cash flow from continuing operations | $ | 259.4 | $ | 141.3 | $ | 760.4 | $ | 671.7 | |||||||
Production cost of sales from continuing operations per ounce sold on a by-product basis is a non-GAAP ratio which calculates the Company’s non-gold production as a credit against its per ounce production costs, rather than converting its non-gold production into gold equivalent ounces and crediting it to total production, as is the case in co-product accounting. Management believes that this ratio provides investors with the ability to better evaluate Kinross’ production cost of sales per ounce on a comparable basis with other major gold producers who routinely calculate their cost of sales per ounce using by-product accounting rather than co-product accounting.
The following table provides a reconciliation of production cost of sales from continuing operations per ounce sold on a by-product basis for the periods presented:
| (unaudited, expressed in millions of U.S. dollars, | Three months ended | Nine months ended | ||||||||||||
| except ounces and production cost of sales per ounce) | September 30, | September 30, | ||||||||||||
| 2022 | 2021 | 2022 | 2021 | |||||||||||
| Production cost of sales from continuing operations - as reported | $ | 465.3 | $ | 289.8 | $ | 1,279.2 | $ | 914.0 | ||||||
| Less: silver revenue(a) | (23.6 | ) | (6.4 | ) | (37.0 | ) | (20.0 | ) | ||||||
| Production cost of sales from continuing operations net of silver by-product revenue | $ | 441.7 | $ | 283.4 | $ | 1,242.2 | $ | 894.0 | ||||||
| Gold ounces sold from continuing operations | 480,775 | 321,528 | 1,286,196 | 1,093,121 | ||||||||||
| Total gold equivalent ounces sold from continuing operations | 494,413 | 325,162 | 1,307,219 | 1,104,293 | ||||||||||
| Production cost of sales from continuing operations per ounce sold on a by-product basis | $ | 919 | $ | 881 | $ | 966 | $ | 818 | ||||||
| Production cost of sales from continuing operations per equivalent ounce sold(b) | $ | 941 | $ | 891 | $ | 979 | $ | 828 | ||||||
See page 22 for details of the footnotes referenced within the table above.
All-in sustaining cost and attributable all-in cost from continuing operations per ounce sold on a by-product basis are non-GAAP financial measures and ratios, as applicable, calculated based on guidance published by the World Gold Council (“WGC”). The WGC is a market development organization for the gold industry and is an association whose membership comprises leading gold mining companies including Kinross. Although the WGC is not a mining industry regulatory organization, it worked closely with its member companies to develop these metrics. Adoption of the all-in sustaining cost and all-in cost metrics is voluntary and not necessarily standard, and therefore, these measures and ratios presented by the Company may not be comparable to similar measures and ratios presented by other issuers. The Company believes that the all-in sustaining cost and all-in cost measures complement existing measures and ratios reported by Kinross.
All-in sustaining cost includes both operating and capital costs required to sustain gold production on an ongoing basis. The value of silver sold is deducted from the total production cost of sales as it is considered residual production. Sustaining operating costs represent expenditures incurred at current operations that are considered necessary to maintain current production. Sustaining capital represents capital expenditures at existing operations comprising mine development costs and ongoing replacement of mine equipment and other capital facilities, and does not include capital expenditures for major growth projects or enhancement capital for significant infrastructure improvements at existing operations.
All-in cost is comprised of all-in sustaining cost as well as operating expenditures incurred at locations with no current operation, or costs related to other non-sustaining activities, and capital expenditures for major growth projects or enhancement capital for significant infrastructure improvements at existing operations.
All-in sustaining cost and attributable all-in cost from continuing operations per ounce sold on a by-product basis are calculated by adjusting production cost of sales from continuing operations, as reported on the interim condensed consolidated statements of operations, as follows:
| (unaudited, expressed in millions of U.S. dollars, | Three months ended | Nine months ended | |||||||||||||
| except ounces and costs per ounce) | September 30, | September 30, | |||||||||||||
| 2022 | 2021 | 2022 | 2021 | ||||||||||||
| Production cost of sales from continuing operations - as reported | $ | 465.3 | $ | 289.8 | $ | 1,279.2 | $ | 914.0 | |||||||
| Less: silver revenue from continuing operations(a) | (23.6 | ) | (6.4 | ) | (37.0 | ) | (20.0 | ) | |||||||
| Production cost of sales from continuing operations net of silver by-product revenue | $ | 441.7 | $ | 283.4 | $ | 1,242.2 | $ | 894.0 | |||||||
| Adjusting items: | |||||||||||||||
| General and administrative(d) | 27.3 | 26.4 | 87.5 | 85.5 | |||||||||||
| Other operating expense - sustaining(e) | 11.7 | 2.5 | 23.5 | 7.8 | |||||||||||
| Reclamation and remediation - sustaining(f) | 10.7 | 10.2 | 28.5 | 29.2 | |||||||||||
| Exploration and business development - sustaining(g) | 7.4 | 10.1 | 22.9 | 24.7 | |||||||||||
| Additions to property, plant and equipment - sustaining(h) | 105.9 | 98.5 | 224.6 | 206.3 | |||||||||||
| Lease payments - sustaining(i) | 5.6 | 7.8 | 16.3 | 23.2 | |||||||||||
| All-in Sustaining Cost on a by-product basis | $ | 610.3 | $ | 438.9 | $ | 1,645.5 | $ | 1,270.7 | |||||||
| Adjusting items on an attributable(c) basis: | |||||||||||||||
| Other operating expense - non-sustaining(e) | 11.2 | 8.9 | 32.3 | 28.1 | |||||||||||
| Reclamation and remediation - non-sustaining(f) | 2.8 | 0.8 | 6.1 | 2.5 | |||||||||||
| Exploration and business development - non-sustaining(g) | 34.6 | 14.2 | 82.2 | 38.1 | |||||||||||
| Additions to property, plant and equipment - non-sustaining(h) | 88.4 | 104.2 | 218.0 | 356.5 | |||||||||||
| Lease payments - non-sustaining(i) | 0.4 | 0.7 | 0.8 | 0.9 | |||||||||||
| All-in Cost on a by-product basis - attributable(c) | $ | 747.7 | $ | 567.7 | $ | 1,984.9 | $ | 1,696.8 | |||||||
| Gold ounces sold from continuing operations | 480,775 | 321,528 | 1,286,196 | 1,093,121 | |||||||||||
| All-in sustaining cost from continuing operations per ounce sold on a by-product basis | $ | 1,269 | $ | 1,365 | $ | 1,279 | $ | 1,162 | |||||||
| Attributable(c) all-in cost from continuing operations per ounce sold on a by-product basis | $ | 1,555 | $ | 1,766 | $ | 1,543 | $ | 1,552 | |||||||
| Production cost of sales from continuing operations per equivalent ounce sold(b) | $ | 941 | $ | 891 | $ | 979 | $ | 828 | |||||||
See page 22 for details of the footnotes referenced within the table above.
The Company also assesses its all-in sustaining cost and attributable all-in cost from continuing operations on a gold equivalent ounce basis. Under these non-GAAP financial measures and ratios, the Company’s production of silver is converted into gold equivalent ounces and credited to total production.
All-in sustaining cost and attributable all-in cost from continuing operations per equivalent ounce sold are calculated by adjusting total production cost of sales from continuing operations, as reported on the interim condensed consolidated statements of operations, as follows:
| (unaudited, expressed in millions of U.S. dollars, except ounces and costs per equivalent ounce) | Three months ended | Nine months ended | |||||||||||||
| September 30, | September 30, | ||||||||||||||
| 2022 | 2021 | 2022 | 2021 | ||||||||||||
| Production cost of sales from continuing operations - as reported | $ | 465.3 | $ | 289.8 | $ | 1,279.2 | $ | 914.0 | |||||||
| Adjusting items: | |||||||||||||||
| General and administrative(d) | 27.3 | 26.4 | 87.5 | 85.5 | |||||||||||
| Other operating expense - sustaining(e) | 11.7 | 2.5 | 23.5 | 7.8 | |||||||||||
| Reclamation and remediation - sustaining(f) | 10.7 | 10.2 | 28.5 | 29.2 | |||||||||||
| Exploration and business development - sustaining(g) | 7.4 | 10.1 | 22.9 | 24.7 | |||||||||||
| Additions to property, plant and equipment - sustaining(h) | 105.9 | 98.5 | 224.6 | 206.3 | |||||||||||
| Lease payments - sustaining(i) | 5.6 | 7.8 | 16.3 | 23.2 | |||||||||||
| All-in Sustaining Cost | $ | 633.9 | $ | 445.3 | $ | 1,682.5 | $ | 1,290.7 | |||||||
| Adjusting items on an attributable(c) basis: | |||||||||||||||
| Other operating expense - non-sustaining(e) | 11.2 | 8.9 | 32.3 | 28.1 | |||||||||||
| Reclamation and remediation - non-sustaining(f) | 2.8 | 0.8 | 6.1 | 2.5 | |||||||||||
| Exploration and business development - non-sustaining(g) | 34.6 | 14.2 | 82.2 | 38.1 | |||||||||||
| Additions to property, plant and equipment - non-sustaining(h) | 88.4 | 104.2 | 218.0 | 356.5 | |||||||||||
| Lease payments - non-sustaining(i) | 0.4 | 0.7 | 0.8 | 0.9 | |||||||||||
| All-in Cost - attributable(c) | $ | 771.3 | $ | 574.1 | $ | 2,021.9 | $ | 1,716.8 | |||||||
| Gold equivalent ounces sold from continuing operations | 494,413 | 325,162 | 1,307,219 | 1,104,293 | |||||||||||
| All-in sustaining cost from continuing operations per equivalent ounce sold | $ | 1,282 | $ | 1,369 | $ | 1,287 | $ | 1,169 | |||||||
| Attributable(c) all-in cost from continuing operations per equivalent ounce sold | $ | 1,560 | $ | 1,766 | $ | 1,547 | $ | 1,555 | |||||||
| Production cost of sales from continuing operations per equivalent ounce sold(b) | $ | 941 | $ | 891 | $ | 979 | $ | 828 | |||||||
See page 22 for details of the footnotes referenced within the table above.
Attributable All-In Sustaining Cost and All-In Cost per Equivalent Ounce Sold – Years Ended December 31, 2021 and 2020
Attributable all-in sustaining cost and all-in cost per equivalent ounce sold are calculated by adjusting total production cost of sales, as reported on the consolidated statements of operations for the years ended December 31, 2021 and 2020, as follows:
| (expressed in millions of U.S. dollars, except ounces and costs per equivalent ounce) | |||||||
| Years ended December 31, | |||||||
| 2021 | 2020 | ||||||
| Production cost of sales - as reported | $ | 1,726.1 | $ | 1,725.7 | |||
| Less: portion attributable to Chirano non-controlling interest(j) | (20.2 | ) | (19.6 | ) | |||
| Attributable(k) production cost of sales | $ | 1,705.9 | $ | 1,706.1 | |||
| Adjusting items on an attributable(k) basis: | |||||||
| General and administrative(m) | 126.6 | 117.9 | |||||
| Other operating expense - sustaining(n) | 10.6 | 9.6 | |||||
| Reclamation and remediation - sustaining(o) | 43.2 | 54.0 | |||||
| Exploration and business development - sustaining(p) | 40.0 | 48.3 | |||||
| Additions to property, plant and equipment - sustaining(q) | 386.0 | 373.5 | |||||
| Lease payments - sustaining(r) | 32.8 | 19.7 | |||||
| All-in Sustaining Cost - attributable(k) | $ | 2,345.1 | $ | 2,329.1 | |||
| Other operating expense - non-sustaining(n) | 38.1 | 55.9 | |||||
| Reclamation and remediation - non-sustaining(o) | 3.4 | 5.0 | |||||
| Exploration and business development - non-sustaining(p) | 91.3 | 43.3 | |||||
| Additions to property, plant and equipment - non-sustaining(q) | 544.6 | 536.9 | |||||
| Lease payments - non-sustaining(r) | 1.0 | 1.0 | |||||
| All-in Cost - attributable(k) | $ | 3,023.5 | $ | 2,971.2 | |||
| Gold equivalent ounces sold | 2,075,738 | 2,375,548 | |||||
| Less: portion attributable to Chirano non-controlling interest(l) | (14,829 | ) | (16,621 | ) | |||
| Attributable(k) gold equivalent ounces sold | 2,060,909 | 2,358,927 | |||||
| Attributable(k) all-in sustaining cost per equivalent ounce sold | $ | 1,138 | $ | 987 | |||
| Attributable(k) all-in cost per equivalent ounce sold | $ | 1,467 | $ | 1,260 | |||
| Consolidated production cost of sales per equivalent ounce sold(s) | $ | 832 | $ | 726 | |||
(a) “Silver revenue” represents the portion of metal sales realized from the production of the secondary or by-product metal (i.e., silver). Revenue from the sale of silver, which is produced as a by-product of the process used to produce gold, effectively reduces the cost of gold production.
(b) “Production cost of sales from continuing operations per equivalent ounce sold” is defined as production cost of sales from continuing operations divided by total gold equivalent ounces sold from continuing operations.
(c) “Attributable” includes Kinross’ share of Manh Choh (70%) costs. As Manh Choh is a non-operating site, the attributable costs are non-sustaining costs and as such only impact the all-in-cost measures.
(d) “General and administrative” expenses is as reported on the interim condensed consolidated statements of operations, net of certain restructuring expenses. General and administrative expenses are considered sustaining costs as they are required to be absorbed on a continuing basis for the effective operation and governance of the Company.
(e) “Other operating expense – sustaining” is calculated as “Other operating expense” as reported on the interim condensed consolidated statements of operations, less other operating and reclamation and remediation expenses related to non-sustaining activities as well as other items not reflective of the underlying operating performance of our business. Other operating expenses are classified as either sustaining or non-sustaining based on the type and location of the expenditure incurred. The majority of other operating expenses that are incurred at existing operations are considered costs necessary to sustain operations, and are therefore classified as sustaining. Other operating expenses incurred at locations where there is no current operation or related to other non-sustaining activities are classified as non-sustaining.
(f) “Reclamation and remediation - sustaining” is calculated as current period accretion related to reclamation and remediation obligations plus current period amortization of the corresponding reclamation and remediation assets, and is intended to reflect the periodic cost of reclamation and remediation for currently operating mines. Reclamation and remediation costs for development projects or closed mines are excluded from this amount and classified as non-sustaining.
(g) “Exploration and business development – sustaining” is calculated as “Exploration and business development” expenses as reported on the interim condensed consolidated statements of operations, less non-sustaining exploration and business development expenses. Exploration expenses are classified as either sustaining or non-sustaining based on a determination of the type and location of the exploration expenditure. Exploration expenditures within the footprint of operating mines are considered costs required to sustain current operations and so are included in sustaining costs. Exploration expenditures focused on new ore bodies near existing mines (i.e. brownfield), new exploration projects (i.e., greenfield) or for other generative exploration activity not linked to existing mining operations are classified as non-sustaining. Business development expenses are classified as either sustaining or non-sustaining based on a determination of the type of expense and requirement for general or growth related operations.
(h) “Additions to property, plant and equipment – sustaining” represents the majority of capital expenditures at existing operations including capitalized exploration costs, periodic capitalized stripping and underground mine development costs, ongoing replacement of mine equipment and other capital facilities and other capital expenditures and is calculated as total additions to property, plant and equipment (as reported on the interim condensed consolidated statements of cash flows), less non-sustaining capital. Non-sustaining capital represents capital expenditures for major projects, including major capital stripping projects at existing operations that are expected to materially benefit the operation, as well as enhancement capital for significant infrastructure improvements at existing operations. Non-sustaining capital expenditures during the three and nine months ended September 30, 2022, primarily related to major projects at La Coipa and Tasiast. Non-sustaining capital expenditures during the three and nine months ended September 30, 2021, primarily related to major projects at Tasiast, Fort Knox, La Coipa and Lobo-Marte.
(i) “Lease payments – sustaining” represents the majority of lease payments as reported on the interim condensed consolidated statements of cash flows and is made up of the principal and financing components of such cash payments, less non-sustaining lease payments. Lease payments for development projects or closed mines are classified as non-sustaining.
(j) The portion attributable to Chirano non-controlling interest represents the non-controlling interest (10%) in the production cost of sales for the Chirano mine for the years ended December 31, 2021 and 2020.
(k) “Attributable” includes Kinross' share of Chirano (90%) production and costs, and Manh Choh (70%) costs for the years ended December 31, 2021 and 2020.
(l) “Portion attributable to Chirano non-controlling interest” represents the non-controlling interest (10%) in the ounces sold from the Chirano mine for the years ended December 31, 2021 and 2020.
(m) “General and administrative” expenses is as reported on the consolidated statements of operations for the years ended December 31, 2021 and 2020, net of certain restructuring expenses. General and administrative expenses are considered sustaining costs as they are required to be absorbed on a continuing basis for the effective operation and governance of the Company.
(n) “Other operating expense – sustaining” is calculated as “Other operating expense” as reported on the consolidated statements of operations for the years ended December 31, 2021 and 2020, less other operating and reclamation and remediation expenses related to non-sustaining activities as well as other items not reflective of the underlying operating performance of our business. Other operating expenses are classified as either sustaining or non-sustaining based on the type and location of the expenditure incurred. The majority of other operating expenses that are incurred at existing operations are considered costs necessary to sustain operations, and are therefore classified as sustaining. Other operating expenses incurred at locations where there is no current operation or related to other non-sustaining activities are classified as non-sustaining.
(o) “Reclamation and remediation - sustaining” is calculated as accretion related to reclamation and remediation obligations plus amortization of the corresponding reclamation and remediation assets for the years ended December 31, 2021 and 2020, and is intended to reflect the periodic cost of reclamation and remediation for currently operating mines. Reclamation and remediation costs for development projects or closed mines are excluded from this amount and classified as non-sustaining.
(p) “Exploration and business development – sustaining” is calculated as “Exploration and business development” expenses as reported on the consolidated statements of operations for the years ended December 31, 2021 and 2020, less non-sustaining exploration and business development expenses. Exploration expenses are classified as either sustaining or non-sustaining based on a determination of the type and location of the exploration expenditure. Exploration expenditures within the footprint of operating mines are considered costs required to sustain current operations and so are included in sustaining costs. Exploration expenditures focused on new ore bodies near existing mines (i.e. brownfield), new exploration projects (i.e., greenfield) or for other generative exploration activity not linked to existing mining operations are classified as non-sustaining. Business development expenses are classified as either sustaining or non-sustaining based on a determination of the type of expense and requirement for general or growth related operations.
(q) “Additions to property, plant and equipment – sustaining” represents the majority of capital expenditures at existing operations for the years ended December 31, 2021 and 2020, including capitalized exploration costs, periodic capitalized stripping and underground mine development costs, ongoing replacement of mine equipment and other capital facilities and other capital expenditures and is calculated as total additions to property, plant and equipment (as reported on the consolidated statements of cash flows), less non-sustaining capital. Non-sustaining capital represents capital expenditures for major projects, including major capital stripping projects at existing operations that are expected to materially benefit the operation, as well as enhancement capital for significant infrastructure improvements at existing operations. Non-sustaining capital expenditures during the year ended December 31, 2021, primarily related to major projects at Tasiast, La Coipa, Udinsk, Fort Knox, and Round Mountain. Non-sustaining capital expenditures during the year ended December 31, 2020, primarily related to major projects at Tasiast, Fort Knox and Round Mountain.
(r) “Lease payments – sustaining” represents the majority of lease payments as reported on the consolidated statements of cash flows for the years ended December 31, 2021 and 2020, and is made up of the principal and financing components of such cash payments, less non-sustaining lease payments. Lease payments for development projects or closed mines are classified as non-sustaining.
(s) “Consolidated production cost of sales per equivalent ounce sold” is defined as production cost of sales, as reported on the consolidated statements of operations for the years ended December 31, 2021 and 2020, divided by total gold equivalent ounces sold.
APPENDIX A
Recent LP Fault zone assay results
| Hole ID | From (m) | To (m) | Width (m) | True Width (m) | Au (g/t) | Target | |
| BR-535 | 89.0 | 96.9 | 7.9 | 6.8 | 1.23 | Yuma | |
| BR-535 | and | 152.8 | 177.2 | 24.4 | 20.7 | 1.05 | |
| BR-535 | and | 189.0 | 236.6 | 47.6 | 43.3 | 0.45 | |
| BR-545 | 428.5 | 453.8 | 25.3 | 24.5 | 3.64 | Yauro | |
| BR-545 | including | 429.5 | 431.4 | 1.95 | 1.8 | 36.34 | |
| BR-545 | and | 459.5 | 472.8 | 13.35 | 10.3 | 0.38 | |
| BR-545 | and | 486.9 | 492.5 | 5.6 | 5.0 | 0.60 | |
| BR-567 | 54.2 | 57.2 | 3 | 2.3 | 1.74 | Viggo | |
| BR-576 | 666.8 | 670.0 | 3.25 | 2.8 | 0.60 | Yuma | |
| BR-576 | and | 703.0 | 711.1 | 8.1 | 7.1 | 11.83 | |
| BR-576 | including | 704.0 | 707.0 | 3 | 2.8 | 29.54 | |
| BR-576 | and | 742.3 | 755.3 | 13 | 10.3 | 0.43 | |
| BR-576 | and | 809.7 | 815.7 | 6 | 5.0 | 0.59 | |
| BR-577 | 803.8 | 823.2 | 19.4 | 16.3 | 0.53 | Yuma | |
| BR-577 | and | 886.0 | 892.0 | 6 | 5.6 | 0.89 | |
| BR-587 | 513.1 | 516.1 | 3 | 2.5 | 0.66 | Yauro | |
| BR-587 | and | 529.2 | 563.0 | 33.8 | 26.4 | 0.35 | |
| BR-587 | and | 575.6 | 584.9 | 9.3 | 8.9 | 0.63 | |
| BR-587 | and | 626.0 | 634.0 | 8 | 6.7 | 0.35 | |
| BR-587 | and | 642.3 | 697.5 | 55.2 | 48.6 | 0.67 | |
| BR-587 | and | 761.8 | 772.4 | 10.6 | 9.9 | 1.86 | |
| BR-587 | including | 767.9 | 769.7 | 1.8 | 1.4 | 6.66 | |
| BR-587 | and | 790.9 | 802.5 | 11.6 | 10.1 | 0.31 | |
| BR-587 | and | 849.6 | 854.5 | 4.9 | 4.0 | 0.39 | |
| BR-596 | 687.1 | 694.5 | 7.4 | 6.6 | 3.73 | Yuma | |
| BR-596 | including | 687.1 | 691.0 | 3.9 | 3.7 | 6.85 | |
| BR-596 | and | 701.0 | 738.8 | 37.75 | 28.3 | 1.03 | |
| BR-597 | 402.1 | 421.3 | 19.15 | 17.8 | 0.31 | Yuma | |
| BR-597 | and | 432.3 | 442.3 | 10.05 | 8.5 | 0.77 | |
| BR-597 | and | 452.7 | 461.8 | 9.05 | 7.2 | 0.40 | |
| BR-597 | and | 473.8 | 484.4 | 10.55 | 10.2 | 0.53 | |
| BR-597 | and | 677.0 | 688.0 | 11 | 10.6 | 1.14 | |
| BR-598 | 426.7 | 458.4 | 31.7 | 23.1 | 0.43 | Yuma | |
| BR-598 | and | 485.8 | 491.8 | 6 | 4.9 | 0.32 | |
| BR-598 | and | 498.3 | 501.3 | 3 | 2.6 | 0.79 | |
| BR-598 | and | 506.8 | 515.5 | 8.7 | 6.8 | 0.42 | |
| BR-611 | 482.0 | 498.5 | 16.5 | 14.5 | 0.76 | Auro | |
| BR-611 | and | 508.7 | 525.8 | 17.1 | 15.6 | 0.79 | |
| BR-611 | and | 563.1 | 567.2 | 4.1 | 3.7 | 0.48 | |
| BR-611 | and | 590.7 | 606.0 | 15.3 | 13.8 | 0.60 | |
| BR-611 | and | 683.1 | 684.4 | 1.3 | 1.1 | 7.48 | |
| BR-612 | 399.0 | 412.5 | 13.5 | 12.7 | 1.91 | Auro | |
| BR-612 | including | 402.0 | 405.0 | 3 | 2.8 | 4.27 | |
| BR-612 | and | 436.0 | 441.0 | 5 | 4.1 | 19.97 | |
| BR-612 | including | 436.0 | 439.5 | 3.5 | 3.1 | 27.77 | |
| BR-612 | and | 461.0 | 466.6 | 5.6 | 4.1 | 1.39 | |
| BR-613 | 493.8 | 501.3 | 7.5 | 7.1 | 0.46 | Auro | |
| BR-614A | 327.0 | 330.0 | 3 | 2.3 | 0.36 | Auro | |
| BR-614A | and | 359.3 | 366.7 | 7.45 | 6.3 | 1.42 | |
| BR-614A | and | 390.0 | 394.8 | 4.8 | 3.9 | 1.44 | |
| BR-614A | and | 453.0 | 457.1 | 4.1 | 3.9 | 0.39 | |
| BR-621 | 174.0 | 178.6 | 4.6 | 4.2 | 0.67 | Auro | |
| BR-621 | and | 189.7 | 205.3 | 15.6 | 14.4 | 0.38 | |
| BR-621 | and | 245.3 | 250.0 | 4.7 | 3.8 | 0.68 | |
| BR-621 | and | 311.5 | 320.0 | 8.5 | 7.7 | 0.51 | |
| BR-621 | and | 330.0 | 374.9 | 44.9 | 43.1 | 2.27 | |
| BR-621 | including | 347.0 | 365.8 | 18.75 | 16.5 | 3.16 | |
| BR-621 | and including | 372.0 | 373.0 | 1 | 1.0 | 26.50 | |
| BR-621 | and | 468.0 | 471.9 | 3.9 | 3.6 | 0.62 | |
| BR-621 | and | 480.5 | 495.0 | 14.5 | 11.2 | 0.48 | |
| BR-622 | 597.0 | 600.4 | 3.4 | 2.7 | 0.33 | Auro | |
| BR-622 | and | 618.0 | 621.0 | 3 | 2.9 | 0.32 | |
| BR-622 | and | 777.1 | 793.5 | 16.4 | 14.3 | 0.69 | |
| BR-622 | and | 804.5 | 807.5 | 3 | 2.3 | 0.33 | |
| BR-622 | and | 833.5 | 838.3 | 4.75 | 4.6 | 0.85 | |
| BR-623 | 545.0 | 551.0 | 6 | 4.4 | 2.03 | Auro | |
| BR-623 | and | 578.0 | 608.8 | 30.75 | 22.8 | 7.62 | |
| BR-623 | including | 585.7 | 597.0 | 11.3 | 10.9 | 18.60 | |
| BR-623 | and | 627.3 | 628.0 | 0.75 | 0.7 | 18.90 | |
| BR-623 | and | 755.0 | 763.3 | 8.3 | 7.1 | 0.36 | |
| BR-623 | and | 806.7 | 809.6 | 2.95 | 2.8 | 3.23 | |
| BR-624 | 634.8 | 652.0 | 17.2 | 13.4 | 0.43 | Auro | |
| BR-624 | and | 670.0 | 698.5 | 28.5 | 23.1 | 7.11 | |
| BR-624 | including | 677.1 | 684.0 | 6.95 | 5.1 | 26.83 | |
| BR-624 | and | 823.0 | 832.0 | 9.05 | 7.5 | 0.58 | |
| BR-632 | 33.2 | 37.6 | 4.4 | 4.2 | 0.69 | Viggo | |
| BR-632 | and | 52.8 | 63.3 | 10.5 | 8.4 | 0.73 | |
| BR-632 | and | 69.0 | 69.7 | 0.7 | 0.6 | 21.20 | |
| BR-633 | 80.5 | 89.1 | 8.6 | 7.6 | 0.34 | Viggo | |
| BR-633 | and | 114.7 | 121.6 | 6.9 | 5.9 | 0.35 | |
| BR-637 | 315.0 | 324.7 | 9.7 | 7.3 | 1.20 | Viggo | |
| BR-638 | 184.5 | 189.0 | 4.5 | 4.2 | 1.26 | Viggo | |
| BR-639 | 193.5 | 202.5 | 9 | 8.3 | 0.72 | Viggo | |
| BR-640 | 256.9 | 263.5 | 6.6 | 5.4 | 1.36 | Viggo | |
| BR-640 | and | 277.5 | 287.3 | 9.8 | 9.5 | 0.63 | |
| BR-640 | and | 311.0 | 316.0 | 5 | 4.4 | 0.85 | |
| BR-641 | 325.5 | 333.0 | 7.5 | 7.3 | 1.09 | Viggo | |
| BR-641 | and | 379.3 | 382.5 | 3.25 | 2.4 | 1.71 | |
| BR-641 | and | 407.0 | 410.0 | 3 | 2.2 | 0.34 | |
| BR-641 | and | 420.0 | 424.9 | 4.9 | 3.8 | 0.32 | |
| BR-642 | 413.0 | 419.3 | 6.3 | 4.6 | 0.36 | Viggo | |
| BR-643 | 325.5 | 330.5 | 5 | 4.8 | 0.88 | Viggo | |
| BR-643 | and | 353.7 | 355.0 | 1.3 | 1.0 | 6.98 | |
| BR-643 | and | 379.0 | 383.0 | 4 | 3.0 | 0.39 | |
| BR-643 | and | 513.0 | 513.7 | 0.7 | 0.7 | 17.70 | |
| BR-644 | 405.0 | 421.8 | 16.75 | 14.4 | 0.39 | Viggo | |
| BR-646 | 339.7 | 350.9 | 11.2 | 10.4 | 0.58 | Viggo | |
| BR-646 | and | 397.5 | 402.0 | 4.5 | 4.0 | 0.38 | |
| BR-647 | 495.0 | 498.0 | 3 | 2.7 | 0.40 | Viggo | |
| BR-650 | 42.0 | 47.5 | 5.5 | 5.0 | 0.61 | Discovery | |
| BR-650 | and | 60.0 | 119.3 | 59.3 | 56.3 | 0.74 | |
| BR-651 | 470.4 | 473.7 | 3.3 | 3.2 | 0.38 | Discovery | |
| BR-651 | and | 751.2 | 758.5 | 7.3 | 6.9 | 0.30 | |
| BR-651 | and | 766.7 | 772.3 | 5.6 | 4.7 | 0.84 | |
| BR-651 | and | 805.5 | 813.8 | 8.3 | 6.9 | 0.55 | |
| BR-651 | and | 861.5 | 867.5 | 6 | 5.7 | 1.51 | |
| BR-651 | including | 865.1 | 867.0 | 1.9 | 1.6 | 3.06 | |
| BR-660 | 86.9 | 149.5 | 62.65 | 49.5 | 1.56 | Discovery | |
| BR-660 | including | 116.8 | 122.5 | 5.7 | 5.2 | 5.10 | |
| BR-660 | and including | 128.8 | 134.8 | 6 | 5.5 | 5.29 | |
| BR-660 | and | 155.3 | 158.8 | 3.5 | 3.3 | 0.35 | |
| BR-660 | and | 167.2 | 172.5 | 5.35 | 3.9 | 0.73 | |
| BR-660 | and | 181.6 | 201.5 | 19.9 | 16.5 | 0.55 | |
| BR-661 | 61.9 | 67.8 | 5.9 | 5.7 | 6.59 | Discovery | |
| BR-661 | including | 66.8 | 67.8 | 1 | 1.0 | 35.00 | |
| BR-661 | and | 76.2 | 93.4 | 17.2 | 15.0 | 0.63 | |
| BR-661 | and | 99.2 | 111.3 | 12.1 | 10.8 | 0.32 | |
| BR-661 | and | 117.0 | 120.0 | 3 | 2.5 | 0.47 | |
| BR-661 | and | 148.0 | 179.8 | 31.85 | 26.8 | 1.18 | |
| BR-661 | and | 192.8 | 201.3 | 8.5 | 6.7 | 0.37 | |
| BR-661 | and | 211.0 | 215.0 | 4 | 3.7 | 0.44 | |
| BR-661 | and | 222.0 | 234.4 | 12.4 | 11.3 | 0.33 | |
| BR-661 | and | 240.5 | 259.1 | 18.6 | 17.7 | 0.60 | |
| BR-661 | and | 267.8 | 296.6 | 28.8 | 26.2 | 1.04 | |
| BR-661 | and | 400.0 | 408.3 | 8.3 | 7.5 | 1.37 | |
| BR-662 | 60.0 | 63.5 | 3.5 | 2.7 | 0.42 | Discovery | |
| BR-662 | and | 94.0 | 103.0 | 9 | 6.7 | 0.37 | |
| BR-662 | and | 124.5 | 136.3 | 11.8 | 10.9 | 0.51 | |
| BR-662 | and | 141.8 | 151.4 | 9.6 | 7.4 | 0.61 | |
| BR-662 | and | 173.0 | 220.3 | 47.3 | 42.1 | 0.72 | |
| BR-670 | No significant intersections | Viggo | |||||
| BR-671 | 114.0 | 121.0 | 7 | 6.5 | 0.56 | Viggo | |
| BR-673 | 381.0 | 389.5 | 8.5 | 7.1 | 0.93 | Viggo | |
| BR-674 | 306.7 | 311.0 | 4.3 | 3.9 | 6.1 | Viggo | |
| BR-675 | 313.2 | 317.8 | 4.6 | 4.2 | 0.44 | Viggo | |
| BR-680 | 628.9 | 634.7 | 5.75 | 4.4 | 2.57 | Yuma | |
| BR-680 | and | 684.0 | 692.7 | 8.7 | 6.7 | 0.51 | |
| BR-680 | and | 782.6 | 787.5 | 4.95 | 4.8 | 0.44 | |
| BR-680 | and | 868.5 | 887.2 | 18.7 | 15.2 | 1.15 | |
| BR-680 | and | 896.4 | 904.0 | 7.6 | 6.5 | 0.68 | |
| BR-690 | 72.1 | 80.0 | 7.95 | 5.9 | 0.61 | Auro | |
| BR-700 | 682.8 | 761.3 | 78.5 | 65.9 | 0.67 | Yuma | |
| BR-700 | and | 802.0 | 817.0 | 15 | 11.9 | 1.88 | |
| BR-700 | including | 812.1 | 813.7 | 1.6 | 1.2 | 15.10 | |
| BR-700 | and | 924.4 | 932.0 | 7.6 | 5.9 | 0.44 | |
| BR-700 | and | 940.7 | 945.5 | 4.75 | 4.1 | 0.45 | |
Results are preliminary in nature and are subject to on-going QA/QC.
APPENDIX B
LP Fault zone long section
A photo accompanying this announcement is available at https://www.globenewswire.com/NewsRoom/AttachmentNg/7f52127f-8bdc-4523-bd45-2ee56104bd31
Composites generated from drill intersections received since July 27, 2022 news release includes assays from 42 fully assayed drill holes at the LP Fault. Composites are generated using 0.3 g/t minimum grade, maximum linear internal dilution of 5.0 m, and allows short high grade intervals greater than 8 GXM to be retained. Results are preliminary in nature and are subject to on-going QA/QC. For full list of significant, composited assay results, see Appendix A.
APPENDIX C
LP grade thickness long section demonstrating depth extension potential
A photo accompanying this announcement is available at https://www.globenewswire.com/NewsRoom/AttachmentNg/90afcb6c-3a2c-48f2-8bb9-1cf48b161ce3
LP grade thickness long section showing conceptual high grade mineralization at depth.
Cautionary statement on forward-looking information
All statements, other than statements of historical fact, contained or incorporated by reference in this news release including, but not limited to, any information as to the future financial or operating performance of Kinross, constitute “forward-looking information” or “forward-looking statements” within the meaning of certain securities laws, including the provisions of the Securities Act (Ontario) and the provisions for “safe harbor” under the United States Private Securities Litigation Reform Act of 1995 and are based on expectations, estimates and projections as of the date of this news release. Forward-looking statements contained in this news release, include, but are not limited to, those under the headings (or headings that include) “Return of Capital”, “Company Guidance”, “Development Projects”, “CEO Commentary”, “Operating Results”, and “Organizational Update”, as well as statements with respect to our guidance for production, production costs of sales, cash flow, free cash flow, all-in sustaining cost of sales, and capital expenditures; the declaration, payment and sustainability of the Company’s dividends or share repurchases; identification of additional resources and reserves; the Company’s liquidity; the schedules and budgets for the Company’s development projects; the Company’s continuous improvement initiatives and project performance or outperformance, as well as references to other possible events, the future price of gold and silver, the timing and amount of estimated future production, costs of production, operating costs; price inflation; capital expenditures, costs and timing of the development of projects and new deposits, estimates and the realization of such estimates (such as mineral or gold reserves and resources or mine life), success of exploration, development and mining, currency fluctuations, capital requirements, project studies, government regulation, permit applications, restarting suspended or disrupted operations; environmental risks and proceedings; and resolution of pending litigation. The words “advance”, “believe”, “continue”, “estimates”, “expects”, “forecast”, “guidance”, “on schedule”, “on track”, “opportunity” “outlook”, “plan”, “potential”, “priority”, “prospect”, or variations of or similar such words and phrases or statements that certain actions, events or results may, could, should or will be achieved, received or taken, or will occur or result and similar such expressions identify forward-looking statements. Forward-looking statements are necessarily based upon a number of estimates and assumptions that, while considered reasonable by Kinross as of the date of such statements, are inherently subject to significant business, economic and competitive uncertainties and contingencies. The estimates, models and assumptions of Kinross referenced, contained or incorporated by reference in this news release, which may prove to be incorrect, include, but are not limited to, the various assumptions set forth herein and in our Management’s Discussion and Analysis (“MD&A”) for the year ended December 31, 2021, and the Annual Information Form dated March 31, 2022 as well as: (1) there being no significant disruptions affecting the operations of the Company, whether due to extreme weather events (including, without limitation, excessive or lack of rainfall, in particular, the potential for further production curtailments at Paracatu resulting from insufficient rainfall and the operational challenges at Fort Knox and Bald Mountain resulting from excessive rainfall, which can impact costs and/or production) and other or related natural disasters, labour disruptions (including but not limited to strikes or workforce reductions), supply disruptions, power disruptions, damage to equipment, pit wall slides or otherwise; (2) permitting, development, operations and production from the Company’s operations and development projects being consistent with Kinross’ current expectations including, without limitation: the maintenance of existing permits and approvals and the timely receipt of all permits and authorizations necessary for the operation of Tasiast; water and power supply and continued operation of the tailings reprocessing facility at Paracatu; permitting and development of the Lobo-Marte project; ramp-up of production at the La Coipa project; in each case in a manner consistent with the Company’s expectations; and the successful completion of exploration consistent with the Company’s expectations at the Company’s projects; (3) political and legal developments in any jurisdiction in which the Company operates being consistent with its current expectations including, without limitation, restrictions or penalties imposed, or actions taken, by any government, including but not limited to amendments to the mining laws, and potential power rationing and tailings facility regulations in Brazil (including those related to financial assurance requirements), potential amendments to water laws and/or other water use restrictions and regulatory actions in Chile, new dam safety regulations, potential amendments to minerals and mining laws and energy levies laws, new regulations relating to work permits, potential amendments to customs and mining laws (including but not limited to amendments to the VAT) and the potential application of the tax code in Mauritania, the European Union’s General Data Protection Regulation or similar legislation in other jurisdictions, potential amendments to and enforcement of tax laws in Mauritania (including, but not limited to, the interpretation, implementation, application and enforcement of any such laws and amendments thereto), and the impact of any trade tariffs being consistent with Kinross’ current expectations; (4) the completion of studies, including optimization studies, improvement studies; scoping studies and pre-feasibility and feasibility studies, on the timelines currently expected and the results of those studies being consistent with Kinross’ current expectations; (5) the exchange rate between the Canadian dollar, Brazilian real, Chilean peso, Mauritanian ouguiya and the U.S. dollar being approximately consistent with current levels; (6) certain price assumptions for gold and silver; (7) prices for diesel, natural gas, fuel oil, electricity and other key supplies being approximately consistent with the Company’s expectations; (8) attributable production and cost of sales forecasts for the Company meeting expectations; (9) the accuracy of: the current mineral reserve and mineral resource estimates of the Company and Kinross’ analysis thereof being consistent with expectations (including but not limited to ore tonnage and ore grade estimates), future mineral resource and mineral reserve estimates being consistent with preliminary work undertaken by the Company, mine plans for the Company’s current and future mining operations, and the Company’s internal models; (10) labour and materials costs increasing on a basis consistent with Kinross’ current expectations; (11) the terms and conditions of the legal and fiscal stability agreements for Tasiast being interpreted and applied in a manner consistent with their intent and Kinross’ expectations and without material amendment or formal dispute (including without limitation the application of tax, customs and duties exemptions and royalties); (12) goodwill and/or asset impairment potential; (13) the regulatory and legislative regime regarding mining, electricity production and transmission (including rules related to power tariffs) in Brazil being consistent with Kinross’ current expectations; (14) access to capital markets, including but not limited to maintaining our current credit ratings consistent with the Company’s current expectations; (15) potential direct or indirect operational impacts resulting from infectious diseases or pandemics such as COVID-19; (16) changes in national and local government legislation or other government actions; (17) litigation, regulatory proceedings and audits, and the potential ramifications thereof, being concluded in a manner consistent with the Corporation’s expectations (including without limitation litigation in Chile relating to the alleged damage of wetlands and the scope of any remediation plan or other environmental obligations arising therefrom); (18) the Company’s financial results, cash flows and future prospects being consistent with Company expectations in amounts sufficient to permit sustained dividend payments and share buybacks; (19) the impacts of potential future pit wall issues at Round Mountain and carbonaceous material at Bald Mountain being consistent with the Company’s expectations; (20) the anticipated mineralization of the Great Bear Project being consistent with expectations and the potential benefits to Kinross from the project and any upside from the project; (21) the Company’s estimates regarding the timing of completion of the Tasiast 24k project; and (22) that deferred payments in respect of the Ghana divestitures will be paid and, in the event any deferred payment is not paid, the applicable security package will be realized and enforceable in a manner consistent with the Company’s expectations. Known and unknown factors could cause actual results to differ materially from those projected in the forward-looking statements. Such factors include, but are not limited to: the inaccuracy of any of the foregoing assumptions, sanctions (any other similar restrictions or penalties) now or subsequently imposed, other actions taken, by, against, in respect of or otherwise impacting any jurisdiction in which the Company is domiciled or operates (including but not limited to Canada, the European Union and the United States), or any government or citizens of, persons or companies domiciled in, or the Company’s business, operations or other activities in, any such jurisdiction; fluctuations in the currency markets; fluctuations in the spot and forward price of gold or certain other commodities (such as fuel and electricity); price inflation of goods and services; changes in the discount rates applied to calculate the present value of net future cash flows based on country-specific real weighted average cost of capital; changes in the market valuations of peer group gold producers and the Company, and the resulting impact on market price to net asset value multiples; changes in various market variables, such as interest rates, foreign exchange rates, gold or silver prices and lease rates, or global fuel prices, that could impact the mark-to-market value of outstanding derivative instruments and ongoing payments/receipts under any financial obligations; risks arising from holding derivative instruments (such as credit risk, market liquidity risk and mark-to-market risk); changes in national and local government legislation, taxation (including but not limited to income tax, advance income tax, stamp tax, withholding tax, capital tax, tariffs, value-added or sales tax, capital outflow tax, capital gains tax, windfall or windfall profits tax, production royalties, excise tax, customs/import or export taxes/duties, asset taxes, asset transfer tax, property use or other real estate tax, together with any related fine, penalty, surcharge, or interest imposed in connection with such taxes), controls, policies and regulations; the security of personnel and assets; political or economic developments in Canada, the United States, Chile, Brazil, Mauritania, or other countries in which Kinross does business or may carry on business; business opportunities that may be presented to, or pursued by, us; our ability to successfully integrate acquisitions and complete divestitures; operating or technical difficulties in connection with mining, development or refining activities; employee relations; litigation or other claims against, or regulatory investigations and/or any enforcement actions, administrative orders or sanctions in respect of the Company (and/or its directors, officers, or employees) including, but not limited to, securities class action litigation in Canada and/or the United States, environmental litigation or regulatory proceedings or any investigations, enforcement actions and/or sanctions under any applicable anti-corruption, international sanctions and/or anti-money laundering laws and regulations in Canada, the United States or any other applicable jurisdiction; the speculative nature of gold exploration and development including, but not limited to, the risks of obtaining necessary licenses and permits; diminishing quantities or grades of reserves; adverse changes in our credit ratings; and contests over title to properties, particularly title to undeveloped properties. In addition, there are risks and hazards associated with the business of gold exploration, development and mining, including environmental hazards, industrial accidents, unusual or unexpected formations, pressures, cave-ins, flooding and gold bullion losses (and the risk of inadequate insurance, or the inability to obtain insurance, to cover these risks). Many of these uncertainties and contingencies can directly or indirectly affect, and could cause, Kinross’ actual results to differ materially from those expressed or implied in any forward-looking statements made by, or on behalf of, Kinross, including but not limited to resulting in an impairment charge on goodwill and/or assets. There can be no assurance that forward-looking statements will prove to be accurate, as actual results and future events could differ materially from those anticipated in such statements. Forward-looking statements are provided for the purpose of providing information about management’s expectations and plans relating to the future. All of the forward-looking statements made in this news release are qualified by this cautionary statement and those made in our other filings with the securities regulators of Canada and the United States including, but not limited to, the cautionary statements made in the “Risk Analysis” section of our MD&A for the year ended December 31, 2021, and the “Risk Factors” set forth in the Company’s Annual Information Form dated March 31, 2022. These factors are not intended to represent a complete list of the factors that could affect Kinross. Kinross disclaims any intention or obligation to update or revise any forward-looking statements or to explain any material difference between subsequent actual events and such forward-looking statements, except to the extent required by applicable law.
Key Sensitivities
Approximately 70%-80% of the Company's costs are denominated in U.S. dollars.
A 10% change in foreign currency exchange rates would be expected to result in an approximate $20 impact on production cost of sales per equivalent ounce sold13.
Specific to the Brazilian real, a 10% change in the exchange rate would be expected to result in an approximate $30 impact on Brazilian production cost of sales per equivalent ounce sold.
A $10 per barrel change in the price of oil would be expected to result in an approximate $4 impact on production cost of sales per equivalent ounce sold.
A $100 change in the price of gold would be expected to result in an approximate $5 impact on production cost of sales per equivalent ounce sold as a result of a change in royalties.
Other information
Where we say ‘‘we’’, ‘‘us’’, ‘‘our’’, the ‘‘Company’’, or ‘‘Kinross’’ in this news release, we mean Kinross Gold Corporation and/or one or more or all of its subsidiaries, as may be applicable.
The technical information about the Company’s mineral properties contained in this news release has been prepared under the supervision of Mr. John Sims who is a “qualified person” within the meaning of National Instrument 43-101.
All dollar amounts are expressed as U.S. dollars, unless otherwise noted.
Source: Kinross Gold Corporation
________________________
13 Refers to all of the currencies in the countries where the Company has mining operations, fluctuating simultaneously by 10% in the same direction, either appreciating or depreciating, taking into consideration the impact of hedging and the weighting of each currency within our consolidated cost structure.

![]()
Appendix B: LP Fault zone long section
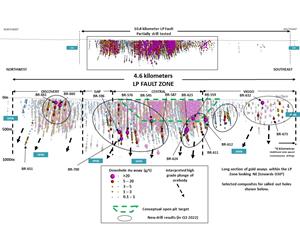
Composites generated from drill intersections received since the July 27, 2022 news release includes assays from 42 fully assayed drill holes at the LP Fault. Composites are generated using 0.3 g/t minimum grade, maximum linear internal dilution of 5.0 m, and allows short high grade intervals greater than 8 GXM to be retained. Results are preliminary in nature and are subject to on-going QA/QC. For full list of significant, composited assay results, see Appendix A.
Appendix C: LP grade thickness long section demonstrating depth extension potential