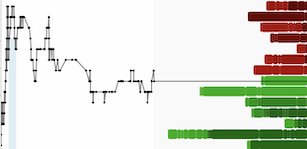
There is a lot of talk about the VIX falling into single digits recently, but what does it really mean? The VIX is a number derived from S&P 500 options pricing. The VIX measures the implied volatility component of S&P options in order to derive a range of 30-day forward volatility for the S&P 500 index.
A VIX of 9.77 implies a +/- 2.82% range for the S&P index over the next 30 days. At 2400 SPX this translates to a range of 2332-2468 over the next 30 days. On the downside 2332 essentially equates to the March/April lows which is basically calling for the status quo in the market to continue.
So what does a VIX of 9.77 really mean? It means a low volatility environment in equities will continue with each little drop of 1-2% quickly finding dip buyers and it means a never ending stream of talking heads focusing on index/passive investing because that is what has worked for the last seven years. This positive reflexivity/feedback cycle is very strong in markets and it is what creates bubbles, and also depressions.
One of the biggest investment fallacies/human cognitive biases is to project the recent past into the future. All investment disclosures say something to the effect of "past performance does not indicate future returns" - yet past performance is all we have to go on and investors base the vast majority of their decisions on the past, not some vision of the future.
The market cycle since the March 2009 low has created a massive shift in investor psychology from fear and despondence to complacency and optimism that the market can generate double-digit annual returns like clockwork, regardless of whatever the macro-market backdrop looks like. US large cap equities are so deep into a positive feedback cycle that it is really hard to imagine what can possibly pull the market out of it. I imagine it would have to be something as earth shattering as nuclear war.
The new normal:

A $9 handle on the VIX with realized volatility (ATR) in a steady downtrend as one increasingly needs a microscope to differentiate SPY's daily candlesticks.
To find out how I am trading the low volatility market environment and preparing for the next surge in volatility in addition to real-time analysis and trade setups in gold mining shares, precious metals, ETFs, and many individual equities subscribe to the Trading Lab today!
DISCLAIMER: The work included in this article is based on current events, corporate presentations, technical charts, and the author’s opinions. It may contain errors, and you shouldn’t make any investment decision based solely on what you read here. This publication contains forward-looking statements, including but not limited to comments regarding predictions and projections. Forward-looking statements address future events and conditions and therefore involve inherent risks and uncertainties. Actual results may differ materially from those currently anticipated in such statements. The views expressed in this publication and on the EnergyandGold website do not necessarily reflect the views of Energy and Gold Publishing LTD, publisher of EnergyandGold.com. This publication is provided for informational and entertainment purposes only and is not a recommendation to buy or sell any security. Always thoroughly do your own due diligence and talk to a licensed investment adviser prior to making any investment decisions. Junior resource companies can easily lose 100% of their value so read company profiles on www.SEDAR.com for important risk disclosures. It’s your money and your responsibility.


