


Last weekend in an interview with @bullmarketmove I pointed out that gold has formed an ascending triangle during the last couple of years:
Gold (Weekly)
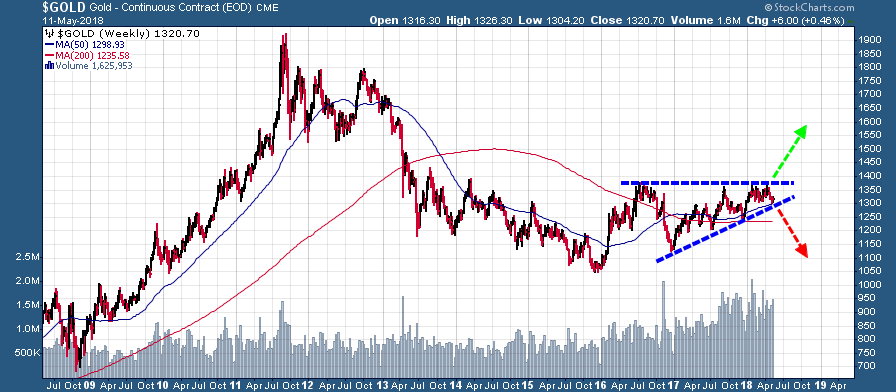
While the odds typically favor an upside breakout from an ascending triangle, a downside resolution is always a distinct possibility. With today's price action the probability of a downside resolution from this chart pattern just became a lot more likely. While there is no exact level below which a breakdown would be confirmed, the $1275 level is certainly significant and a decisive move below this level would be problematic for a number of reasons.
After today's powerful sell-off in gold (-2.12%) it looks the like the yellow metal has a date with a test of trend support drawn from the July 2016 and December 2016 lows:
Gold (Daily)
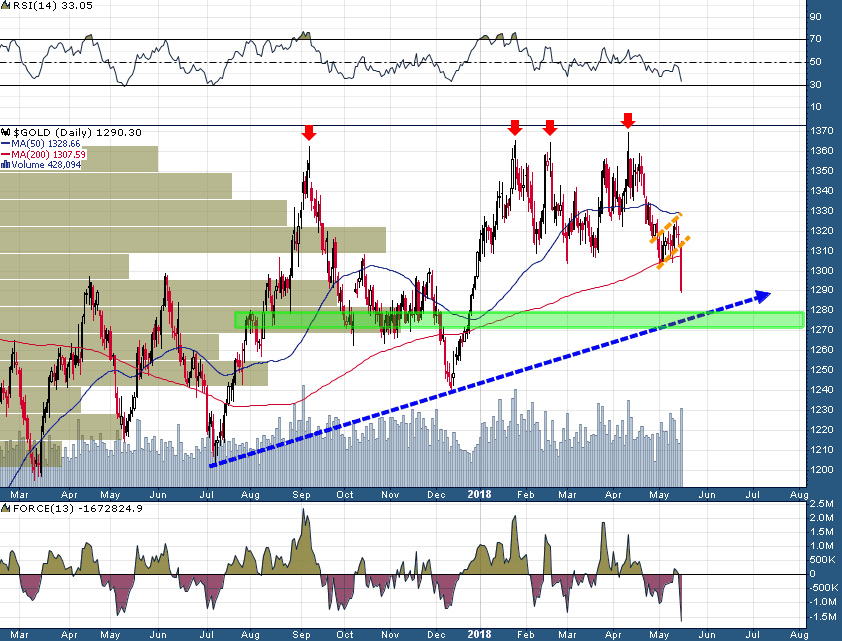
The Force(13) indicator on the daily time frame is now at its lowest level since the November/December 2016 decline. A deeper decline into the $1270s would also likely bring the daily-RSI(14) to below 30 (technically oversold territory). The only ingredients that are still missing from a major bottom call is a capitulation by large speculators in gold futures and a Daily Sentiment Index (DSI) reading below 10 (gold DSI was 23 heading into today). However, another day like today will surely fix that.
The scenario which would likely generate the maximum amount of pain for market participants would be another couple of down days which brings the gold price below $1270, albeit briefly, before a powerful upside reversal and a weekly close back above $1300 - such a scenario would trigger a bevy of sell stops, and probably also get a number of traders net short (below $1275) just in time for the bear trap to be sprung upon them. I discuss potential scenarios so that readers are aware of different possibilities and to also emphasize that while markets can move below certain key price levels intra-day, it is closing prices that matter much more.
Another market that gold traders should keep an eye on is the yield on the 10-year U.S. Treasury Note which moved as high as 3.095% today. It was no accident that gold got crushed today as yields soared. However, the 3.20% yield area on the 10-year is likely to be MAJOR resistance (dating back to the 2008-2011 period) and I imagine that this level is likely to put a lid on this rally in yields. A test of 3.20% on the 10-year yield occurring in unison with a move down to the $1275 area in gold will present an excellent trading opportunity for a potential reversal in both gold and Treasury yields.
DISCLAIMER: The work included in this article is based on current events, technical charts, and the author’s opinions. It may contain errors, and you shouldn’t make any investment decision based solely on what you read here. This publication contains forward-looking statements, including but not limited to comments regarding predictions and projections. Forward-looking statements address future events and conditions and therefore involve inherent risks and uncertainties. Actual results may differ materially from those currently anticipated in such statements. The views expressed in this publication and on the EnergyandGold website do not necessarily reflect the views of Energy and Gold Publishing LTD, publisher of EnergyandGold.com. This publication is provided for informational and entertainment purposes only and is not a recommendation to buy or sell any security. Always thoroughly do your own due diligence and talk to a licensed investment adviser prior to making any investment decisions. Junior resource companies can easily lose 100% of their value so read company profiles on www.SEDAR.com for important risk disclosures. It’s your money and your responsibility.
