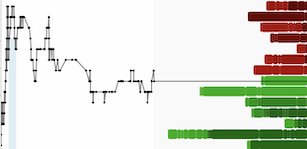
The financial media loves to explain market moves with news events. While it's true that news can be a catalyst, it is also true that markets are often already 'positioned' for the move ahead of time and it doesn't take much to set them into motion.
Equities were positioned for a big upside rip after 9 straight down days in the S&P and word from the FBI that Hillary has been "cleared" was just enough to send futures soaring. However, one must realize that the market was only able to move to such a large magnitude because it was positioned for such a move. The FBI/Hillary stuff is simply an excuse to send the market moving the way it already wanted to.
I want to spend some time on gold. Gold rallied last week and made it as high as $1309. This is an important level because there is a tremendous amount of price memory in the $1307-$1310 area. When a market is not in a clear and powerful trend it is usually most helpful to think of which scenario would confound the largest group of market participants. I believe the recent action in gold is a perfect example of this concept; after getting a large group of market participants bullish on the yellow metal the rug was pulled out to the tune of a ~$80 drop to the $1240s, then once sentiment had turned sufficiently bearish gold posted a $60+ rally over a roughly one month time period, finally just when everyone thought the coast was clear as we had returned above the $1300 level we get a large gap lower over the weekend.
Just like with equities gold was positioned for this move. The retest of the breakdown level and an important area of support/resistance over the last few years was simply too much:

Fibonaccis are an art, not a science. Drawing the Fib retracement from the level in which the 2013 crash began (~$1570) to the ultimate low at $1045 we can see that last week's high reached the midpoint of the entire move. $1308 was also the early 2015 peak from which gold launched into what I believe to be the final leg of a nearly 5-year cyclical bear market.
One doesn't have to be too fancy to use charts effectively. $1310 was support for several months and then that support finally broke. It is normal for markets to retest levels of support after breakdowns occur:

Simpler analysis is more effective. Gold is a range-bound mess until proven otherwise, however, nimble traders can do very well by being disciplined and waiting for the fat-pitches to arrive.
To find out how CEO Technician is trading the volatile gold market you can subscribe to his premium service for real time trade setups and analysis.
DISCLAIMER: The work included in this article is based on current events, technical charts, and the author’s opinions. It may contain errors, and you shouldn’t make any investment decision based solely on what you read here. This publication contains forward-looking statements, including but not limited to comments regarding predictions and projections. Forward-looking statements address future events and conditions and therefore involve inherent risks and uncertainties. Actual results may differ materially from those currently anticipated in such statements. The views expressed in this publication and on the EnergyandGold website do not necessarily reflect the views of Energy and Gold Publishing LTD, publisher of EnergyandGold.com. This publication is provided for informational and entertainment purposes only and is not a recommendation to buy or sell any security. Always thoroughly do your own due diligence and talk to a licensed investment adviser prior to making any investment decisions. Junior resource companies can easily lose 100% of their value so read company profiles on www.SEDAR.com for important risk disclosures. It’s your money and your responsibility.


